10-K: Annual report pursuant to Section 13 and 15(d)
Published on February 20, 2025
UNITED STATES
SECURITIES AND EXCHANGE COMMISSION
Washington, D.C. 20549
FORM 10-K
| ANNUAL REPORT PURSUANT TO SECTION 13 OR 15(d) OF THE SECURITIES EXCHANGE ACT OF 1934 | |||||
For the fiscal year ended December 31 , 2024
OR
| TRANSITION REPORT PURSUANT TO SECTION 13 OR 15(d) OF THE SECURITIES EXCHANGE ACT OF 1934 | |||||
For the transition period from_________to ________
Commission File Number: 0-10200
________________________________________

________________________________________
(Exact name of Registrant as Specified in Its Charter)
| State or Other Jurisdiction of Incorporation or Organization | I.R.S. Employer Identification No. | |||||||
(Address of Principal Executive Offices and Zip Code)
(Registrant’s Telephone Number, Including Area Code)
Securities registered pursuant to Section 12(b) of the Act:
| Title of each class | Trading Symbol | Name of each exchange on which registered | ||||||||||||
| (The NASDAQ Global Select Market®) | ||||||||||||||
Securities registered pursuant to Section 12(g) of the Act:
None
(Title of class)
Indicate by check mark if the registrant is a well-known seasoned issuer, as defined in Rule 405 of the Securities Act. Yes ☒ No ☐
Indicate by check mark if the registrant is not required to file reports pursuant to Section 13 or 15(d) of the Act. Yes ☐ No ☒
Indicate by check mark whether the registrant (1) has filed all reports required to be filed by Section 13 or 15(d) of the Securities Exchange Act of 1934 during the preceding 12 months (or for such shorter period that the registrant was required to file such reports), and (2) has been subject to such filing requirements for the past 90 days. Yes ☒ No ☐
Indicate by check mark whether the registrant has submitted electronically every Interactive Data File required to be submitted pursuant to Rule 405 of Regulation S-T (§ 232.405 of this chapter) during the preceding 12 months (or for such shorter period that the registrant was required to submit such files). Yes ☒ No ☐
Indicate by check mark whether the registrant is a large accelerated filer, an accelerated filer, a non-accelerated filer, smaller reporting company, or an emerging growth company. See the definitions of “large accelerated filer,” “accelerated filer,” “smaller reporting company,” and “emerging growth company” in Rule 12b-2 of the Exchange Act.
| ☒ | Accelerated filer | ☐ | ||||||||||||
| Non-accelerated filer | ☐ |
Smaller reporting company | ||||||||||||
| Emerging growth company | ||||||||||||||
If an emerging growth company, indicate by check mark if the registrant has elected not to use the extended transition period for complying with any new or revised financial accounting standards provided pursuant to Section 13(a) of the Exchange Act. ☐
Indicate by check mark whether the registrant has filed a report on and attestation to its management’s assessment of the effectiveness of its internal control over financial reporting under Section 404(b) of the Sarbanes-Oxley Act (15 U.S.C. 7262(b)) by the registered public accounting firm that prepared or issued its audit report. ☒
If securities are registered pursuant to Section 12(b) of the Act, indicate by check mark whether the financial statements of the registrant included in the filing reflect the correction of an error to previously issued financial statements. ☐
Indicate by check mark whether any of those error corrections are restatements that required a recovery analysis of incentive-based compensation received by any of the registrant’s executive officers during the relevant recovery period pursuant to §240.10D-1(b). ☐
Indicate by check mark whether the registrant is a shell company (as defined in Rule 12b-2 of the Act). Yes ☐ No ☒
The aggregate market value of the voting common stock held by non-affiliates of the registrant was approximately $7.0 billion based on the closing price reported by NASDAQ on June 28, 2024 (the last business day of the registrant’s most recently completed second fiscal quarter). For purposes of making this calculation only, the registrant has defined affiliates as including all executive officers, directors and beneficial owners of more than 10% of the common stock of the registrant.
The number of shares outstanding of the registrant's common stock, as of the close of business on January 31, 2025:
| Common Stock, $.01 par value | ||||||||
DOCUMENTS INCORPORATED BY REFERENCE
Portions of the following documents are incorporated by reference herein:
1. The definitive proxy statement relating to the registrant’s 2025 Annual Meeting of Shareholders, to be filed within 120 days after the end of the fiscal year covered by this annual report, is incorporated by reference in Part III hereof.
SEI INVESTMENTS COMPANY
Fiscal Year Ended December 31, 2024
TABLE OF CONTENTS
| Page | ||||||||
| PART I | ||||||||
| Item 1. | Business. | |||||||
| Item 1A. | Risk Factors. | |||||||
| Item 1B. | Unresolved Staff Comments. | |||||||
| Item 1C. | Cybersecurity. | |||||||
| Item 2. | Properties. | |||||||
| Item 3. | Legal Proceedings. | |||||||
| Item 4. | Mine Safety Disclosures. | |||||||
| PART II | ||||||||
| Item 5. | Market for Registrant’s Common Equity, Related Stockholder Matters and Issuer Purchases of Equity Securities. | |||||||
| Item 6. | [Reserved] | |||||||
| Item 7. | Management’s Discussion and Analysis of Financial Condition and Results of Operations. | |||||||
| Item 7A. | Quantitative and Qualitative Disclosures About Market Risk. | |||||||
| Item 8. | Financial Statements and Supplementary Data. | |||||||
| Item 9. | Changes in and Disagreements With Accountants on Accounting and Financial Disclosure. | |||||||
| Item 9A. | Controls and Procedures. | |||||||
| Item 9B. | Other Information. | |||||||
| Item 9C. | Disclosure Regarding Foreign Jurisdictions that Prevent Inspections. | |||||||
| PART III | ||||||||
| Item 10. | Directors, Executive Officers and Corporate Governance. | |||||||
| Item 11. | Executive Compensation. | |||||||
| Item 12. | Security Ownership of Certain Beneficial Owners and Management and Related Stockholder Matters. | |||||||
| Item 13. | Certain Relationships and Related Transactions, and Director Independence. | |||||||
| Item 14. | Principal Accounting Fees and Services. | |||||||
| PART IV | ||||||||
| Item 15. | Exhibits and Financial Statement Schedules. | |||||||
| Item 16. | Form 10-K Summary. | |||||||
1
PART I
Forward-looking Statements
This Annual Report on Form 10-K contains certain “forward-looking statements” within the meaning of the Private Securities Litigation Reform Act of 1995. These forward-looking statements involve certain known and unknown risks, uncertainties and other factors, many of which are beyond our control, and are not limited to those discussed in Item 1A, Risk Factors. All statements that do not relate to historical or current facts are forward-looking statements. These statements may include words such as "anticipate," "estimate," "expect," "project," "intend," "plan," "believe," "will," and other words and terms of similar meaning in connection with any discussion of future operating or financial performance. In particular, these include statements relating to present or anticipated strategies, products and markets, future revenues, capital expenditures and uses, expansion plans, future financing and liquidity, personnel, and other statements regarding matters that are not historical facts or statements of current condition.
Any or all forward-looking statements contained within this Annual Report on Form 10-K may turn out to be wrong. They can be affected by inaccurate assumptions we might make, or by known or unknown risks and uncertainties. Many factors mentioned in the discussion below will be important in determining future results. Consequently, we cannot guarantee any forward-looking statements. Actual future results may vary materially. Further information about factors that could materially affect its results of operations and financial condition include, but are not limited to, the discussion contained in Item 1A, Risk Factors, in this Annual Report on Form 10-K.
We undertake no obligation to publicly update any forward-looking statements, whether as a result of new information, future events or otherwise, except as required by law. You are advised, however, to consult any further disclosures we make on related subjects in our filings with the U.S. Securities and Exchange Commission (SEC).
Item 1. Business.
Corporate overview
SEI Investments Company (together, with its subsidiaries unless otherwise noted, “SEI” or the “Company”) is a leading global provider of financial technology, operations, and asset management services within the financial services industry.
We tailor our solutions and services to help our clients more effectively deploy their capital—whether that’s money, time, or talent—so they can better serve their clients and achieve their growth objectives.
We are headquartered in Oaks, Pennsylvania, and approximately 5,000 employees support clients from service centers located in the United States, United Kingdom, Ireland, Canada, continental Europe, India, and South Africa.
In 2024, we earned approximately 55% of our revenue from technology and operations outsourcing and 40% from asset management fees, with the remainder attributable to professional services and other ancillary services. SEI provides these services across four core client-oriented business segments; Investment Managers, Private Banks, Investment Advisors, and Institutional Investors. SEI’s clients include 8 of the top 20 U.S. banks and 43 of the top 100 investment managers worldwide, and we manage, advise or administer approximately $1.6 trillion in assets.
Core capabilities
With our core competency pillars of technology, operations, and asset management, the breadth of the markets we serve and capabilities across investment processing, investment operations, and investment management uniquely position us in the financial services industry. We deliver our services standalone or combine multiple capabilities into comprehensive solutions designed to meet the needs of each market we serve globally. Our clients include wealth managers, banks, investment advisors, asset managers, family offices, institutional investors, and ultra-high-net-worth investors.
| For the Year Ended December 31, 2024 | ||||||||||||||||||||||||||||||||||||||
| (all dollar amounts in thousands) | Investment Managers |
Private
Banks
|
Investment Advisors |
Institutional Investors |
Investments in New Businesses |
Total | ||||||||||||||||||||||||||||||||
| Investment Technology & Operations | $ | 697,014 | $ | 381,033 | $ | 57,455 | $ | 9,815 | $ | 25,409 | $ | 1,170,726 | ||||||||||||||||||||||||||
| Asset Management | 363 | 137,512 | 431,630 | 263,679 | 20,234 | 853,418 | ||||||||||||||||||||||||||||||||
| Professional Services & Other | 31,013 | 22,869 | 20,323 | 12,229 | 14,573 | 101,007 | ||||||||||||||||||||||||||||||||
| Total Revenues | $ | 728,390 | $ | 541,414 | $ | 509,408 | $ | 285,723 | $ | 60,216 | $ | 2,125,151 | ||||||||||||||||||||||||||
2
Technology and operations
We provide the technology and operational infrastructure across the front, middle, and back office to help our clients scale, increase efficiency, and improve performance. Capabilities include:
•Business process outsourcing and custody
•Fund administration, depositary services, investment accounting, and investor servicing
•Curated suite of internally managed and third-party investment products, including ETFs, SMAs, and UMAs
•Investment expertise in direct indexing, factor-based, alternatives, and tax management
•Discretionary investment management for institutions in need of expertise, infrastructure and enhanced governance
•Data and information management, analytics, and reporting
•Regulatory and compliance service
•Network operations, cloud, and cybersecurity services
Our proprietary technology platforms include the SEI Wealth PlatformSM (SWP) and its predecessor, TRUST 3000®. We use these technologies to deliver operations and administrative outsourcing services, including custodial and back-office accounting services.
SWP offers a modern, fully-integrated, single infrastructure solution that integrates technology, operational outsourcing, and asset management. Capabilities span the front, middle, and back office and are designed to support a diverse mix of investors, accounts, and asset types. SWP’s open architecture also allows for technology integrations with other SEI capabilities and client systems to enable a seamless wealth management experience.
Investment processing platforms are offered in Software-as-a-Service (SaaS) or Platform-as-a-Service (PaaS) delivery. SaaS includes investment processing software and information processing services. PaaS includes software and information processing services, as well as business processing outsourcing services, including back- and middle-office operations, accounting, and custodial services.
Our technology and operations platform also includes technology and operationally-enabled investment service capabilities for a broad range of traditional and alternative investment managers, delivered as unbundled product components for front, middle, and back offices through our Investment Managers segment.
Asset management
We provide comprehensive solutions for managing personal and institutional wealth. These solutions include investment strategies, customized investment management programs, and SEI-sponsored and third-party investment products to support an investor’s organizational or personal goals.
Investment strategies are typically implemented with investment products that include ETFs, alternative investments, collective investment products, separately managed accounts, and mutual funds. We serve as sponsor, administrator, transfer agent, investment advisor, distributor, and shareholder servicer for many of these products.
Our active, factor-based, and passively managed solutions enable our clients to focus on their clients while implementing processes that help them gain efficiencies, manage risk, and grow their businesses. Solutions are offered both individually and as part of model portfolios, with the majority of our asset management business historically focused on model portfolios. SEI has earned a well-regarded reputation in the market for clients seeking whole portfolio and model portfolio solutions due to our size and long track record in offering these products.
These solutions and programs leverage more than four decades of experience with manager research, advice, asset allocation, and portfolio construction. Additionally, our robust technology offering creates a differentiated competitive advantage. We are able to monetize our technology either directly or as part of a comprehensive asset management offering in which technology is included within our asset management fees.
As of December 31, 2024, we managed $390.2 billion in assets including:
•$180.0 billion invested in fixed-income and equity funds and separately managed account programs;
•$202.4 billion invested in collective trust fund programs; and
•$7.8 billion invested in liquidity or money market funds.
An additional $86.5 billion in assets is managed by our unconsolidated affiliate LSV Asset Management (LSV), a registered investment advisor (RIA) that specializes in value equity management for its clients.
3
Business segments overview
Our business segments are generally organized around our target markets. Financial information about each business segment is contained in "Note 12. Business Segment Information" included in our Notes to Consolidated Financial Statements.
The percentage of consolidated revenues generated by our business segments for the last three years was:
| 2024 | 2023 | 2022 | ||||||||||||||||||
| Investment Managers | 34 | % | 33 | % | 30 | % | ||||||||||||||
| Private Banks | 26 | % | 26 | % | 29 | % | ||||||||||||||
| Investment Advisors | 24 | % | 23 | % | 22 | % | ||||||||||||||
| Institutional Investors | 13 | % | 15 | % | 16 | % | ||||||||||||||
| Investments in New Businesses | 3 | % | 3 | % | 3 | % | ||||||||||||||
| 100 | % | 100 | % | 100 | % | |||||||||||||||
Investment Managers
We provide a comprehensive, outsourced investment management operating platform to alternative and traditional asset managers, fund companies, and sovereign wealth funds. Our clients include asset owners and a diverse, sophisticated group of alternative, traditional, and hybrid investment managers globally.
Our capabilities span the front, middle, and back office to manage assets, including supporting complex fund structures through best-in-class data and information management and analytics; investment operations; regulatory and compliance support; fund administration, fund accounting and depository services; investor reporting; distribution support; and middle office services. We also offer trustee, investment management, and administration services for collective investment trusts, serving the U.S. retirement market.
SEI’s global operational footprint services funds in all major jurisdictions amid a constantly evolving regulatory environment. Our outsourcing solutions across the front-to-back office with best-in-breed technology accommodate investment managers of all sizes and complexities and enables them to focus on core business activities—from the unique needs of emerging and start-up managers to the complex needs of global, multi-asset hybrid managers.
Contracts for the outsourcing services we provide generally have terms ranging from three to five years, and fees are earned primarily as a percentage of assets under management and administration. In addition, 16% of the revenues for this segment is earned as account servicing fees.
Our competitors vary according to the asset class or solutions provided and the domiciles in which they operate. They include SS&C Technologies, State Street, BNY Mellon, Northern Trust, and Citco.
Private Banks
We provide technology, operations, and asset management solutions primarily to the wealth management businesses embedded within banks and trust companies, in addition to independent wealth advisors. Clients include several financial institutions whose relationships span decades with SEI.
Our solutions provide the investment processing, operations, and administrative capabilities that are vital to helping wealth management businesses achieve their business objectives, manage change and complex operations, replace legacy platforms, comply with regulations, and deploy capital more effectively.
Contracts generally range from five to seven years. As of December 31, 2024, we had significant relationships with 117 clients, including TRUST 3000® relationships with 37 bank and trust institutions in the United States, and SWP relationships with 80 signed banks, independent wealth advisers and other wealth managers located in the United Kingdom and the United States.
Our competitors include in-house information technology organizations, as well as wealth management technology service providers such as Fidelity National Information Services, Inc. (FIS), Fi-Tek, SS&C Innovest, FNZ UK Ltd. and Avaloq.
This segment also provides asset management programs to banks, wealth managers and other financial services firms, including 29 clients who had at least $100.0 million each in customer assets invested in our programs as of December 31, 2024. Competitors for our asset management services may include in-house investment teams and global asset management firms, such as LPL Financial and BlackRock.
Investment Advisors
We provide wealth management technology, operations, and asset management solutions for independent financial advisors across the RIA and independent broker/dealer market segments.
4
This segment offers both fully integrated and unbundled solutions that enable advisors to devote more of their resources to growing their businesses and achieving better financial outcomes for their clients.
Our clients are responsible for the investor relationship, including financial plan creation, investment strategy implementation, and customer education and servicing. We provide advisors with a flexible operating platform offering a complete end-to-end business, technology and operational solution with capabilities across the front, middle, and back office, including:
•Technology and administrative services: Enabled by the SEI Wealth Platform, these services include front-office investment management and end-investor collaboration capabilities, middle-office administrative outsourcing, and back-office processing and custody services.
•Customized investment management programs: We provide advisors with an array of investment programs to customize portfolios for their personal or institutional investors. These programs include goals-based strategies, SEI-curated models that utilized multiple structures such as direct indexing, separately managed accounts, ETFs, and mutual funds, to help advisors align diversified portfolios with client needs.
•Advisor services: We help advisors manage and grow their businesses by offering consultative practice management services, including access to our business transition services, case management expertise, third-party applications, thought leadership, and marketing and growth programs.
Fees are typically bundled and embedded in asset management or custody fees.
We compete with other custodians and providers of advisor technology products, money managers (both active and passive), turnkey asset management platform providers, and broker-dealers with affiliated advisor networks. Principal competitors include investment advisory platform providers, such as Envestnet and Orion, as well as diversified firms that focus on custody operations, such as Charles Schwab & Co., Inc., Fidelity Investments, and LPL Financial.
Institutional Investors
Our Institutional Investors business is one of the first and largest providers of outsourced investment management services. Providing fully outsourced CIO (OCIO) and unbundled OCIO services, we primarily serve retirement plan sponsors, healthcare systems, higher education, not-for-profit organizations, and other institutional asset owners.
•OCIO: Supports institutional investors who delegate investment management decisions through a flexible implementation model. Investors outsource some or all investment management functions based on their preferred governance structure, business needs, and financial objectives.
•Unbundled OCIO: Supports internal investment teams through SEI NovusSM, a global portfolio intelligence tool, and SEI’s comprehensive investment processing, shadow accounting, and data and workflow management, as well as access to alternative investment products.
Both fully outsourced and unbundled solutions leverage the breadth of our investment management, advisory, administration, technology, and operational capabilities to help institutional investors make more confident decisions, achieve greater control, reduce risk, and improve efficiencies.
Competitors for OCIO services at larger institutional investors may include global advisory firms offering fiduciary management services, such as Aon Hewitt and Willis Towers Watson, as well as asset management firms like Mercer and Russell Investments. We also compete with numerous investment management firms, including regional or boutique firms with an industry specialization. Competitors for unbundled OCIO services include data analytics software firms and investment data management providers.
Fees in our Institutional Investors business are primarily earned as a percentage of average assets under management calculated using the average of the four-month ending balances preceding the billing date.
Investments in New Businesses
The Investments in New Businesses segment represents other business ventures or research and development activities intended to expand our solutions to new or existing markets, including ultra-high-net-worth families who reside in the United States.
This segment also includes costs associated with providing managed security services through SEI Sphere®, the modularization of larger technology platforms, and a private client wealth management solution offering flexible family office-type services through a highly personalized solution that utilizes a goals-based approach.
5
Human capital
Our talented workforce is the key to our ability to serve our clients globally. At December 31, 2024, we had 5,066 full-time and 32 part-time employees.
Employee unions do not represent any of our employees.
Corporate sustainability
Our values are the foundation from which we drive our company’s and our clients’ long-term success and make an impact on our communities. We work with each other and welcome diverse perspectives to foster an inclusive environment and solve problems that matter. We think and act like owners, having the courage to push boundaries and do the right thing in the best interest of our company, clients, and community. More information about our commitment to corporate sustainability can be found in our Corporate Sustainability Report.
Regulatory considerations
We conduct our operations through several regulated wholly-owned subsidiaries. These subsidiaries include:
•SEI Investments Distribution Co., or SIDCO, a broker-dealer registered with the SEC under the Securities Exchange Act of 1934 and a member of the Financial Industry Regulatory Authority, Inc., or FINRA;
•SEI Investments Management Corporation, or SIMC, an investment advisor registered with the SEC under the Investment Advisers Act of 1940 and with the Commodity Futures Trading Commission, or CFTC, under the Commodity Exchange Act;
•SEI Private Trust Company, or SPTC, a limited purpose federal thrift chartered and regulated by the Office of the Comptroller of the Currency;
•SEI Trust Company, or STC, a Pennsylvania trust company, regulated by the Pennsylvania Department of Banking and Securities;
•SEI Institutional Transfer Agent, Inc., or SITA, a transfer agent registered with the SEC under the Securities Exchange Act of 1934.
•SEI Investments (Europe) Limited, or SIEL, an investment manager and financial institution subject to regulation by the Financial Conduct Authority of the United Kingdom, or FCA;
•SEI Investments Canada Company, or SEI Canada, an investment fund manager that has various other capacities that is regulated by the Ontario Securities Commission and various provincial authorities;
•SEI Investments Global, Limited, or SIGL, a management company for Undertakings for Collective Investment in Transferable Securities, or UCITS, and for Alternative Investment Funds, or AIFs, that is regulated primarily by the Central Bank of Ireland, or CBI;
•SEI Investments - Global Fund Services, Ltd., or GFSL, an authorized provider of administration services for Irish and non-Irish collective investment schemes that is regulated by the CBI;
•SEI Investments - Depositary and Custodial Services (Ireland) Limited, or D&C, an authorized provider of depositary and custodial services that is regulated by the CBI;
•SEI Investments - Luxembourg S.A., or SEI Lux, a professional of the specialized financial sector subject to regulation by the Commission de Surveillance du Secteur Financier of the Grand Duchy of Luxembourg;
•SEI Investments Global (Cayman), Ltd., a full mutual fund administrator that is regulated by the Cayman Island Monetary Authority; and
•SEI Investments (South Africa) (PTY) Limited, a Private Company that is a licensed Financial Service Provider regulated by the Financial Sector Conduct Authority.
In addition to the regulatory authorities listed above, our subsidiaries are subject to the jurisdiction of regulatory authorities in other foreign countries. In addition to our wholly-owned subsidiaries, we also own a minority interest of approximately 38.6% in LSV, which is also an investment advisor registered with the SEC.
The Company, its regulated subsidiaries, their regulated services and solutions and their customers are all subject to extensive legislation, regulation, and supervision that recently has been subject to, and continues to experience, significant change and increased regulatory activity. These changes and regulatory activities could have a material adverse effect on us and our clients.
The various governmental agencies and self-regulatory authorities that regulate or supervise the Company and its subsidiaries have broad administrative powers. In the event of a failure to comply with laws, regulations, and requirements of these agencies and authorities, or to meet regulator expectations, the possible business process changes required or sanctions that may be imposed include the suspension of individual employees, limitations on our ability to engage in
6
business for specified periods of time or a direction that we comply with certain restrictions, the revocation of applicable registration as a broker-dealer, investment advisor or other regulated entity, and, as the case may be, censures and fines. Currently, our subsidiary in the United Kingdom, SIEL, is working with the FCA to determine the nature and scope of remedial actions in which SIEL will engage in order to meet the FCA's expectations and to enable SIEL to continue to grow and execute on its development and offering of new products and solutions. Additionally, certain securities and banking laws applicable to us and our subsidiaries provide for certain private rights of action that could give rise to civil litigation. Any litigation could have significant financial and non-financial consequences including monetary judgments and the requirement to take action or limit activities that could ultimately affect our business.
Governmental scrutiny from regulators, legislative bodies, and law enforcement agencies with respect to matters relating to our regulated subsidiaries and their activities, services and solutions, our business practices, our past actions and other matters has increased dramatically in the past several years. Responding to these examinations, investigations, actions, and lawsuits, regardless of the ultimate outcome of the proceeding, is time consuming and expensive and can divert the time and effort of our senior management from our business. Penalties, fines and changes to business processes sought by regulatory authorities have increased substantially over the last several years, and certain regulators have been more likely in recent years to commence enforcement actions or to advance or support legislation targeted at the financial services industry. We continue to be subject to inquiries from examinations and investigations by supervisory and enforcement divisions of regulatory authorities and expect this to continue in the future. We believe this is also the case with many of our regulated clients. Governmental scrutiny and legal and enforcement proceedings can also have a negative impact on our reputation, our relationship with clients and prospective clients, and on the morale and performance of our employees, which could adversely affect our businesses and results of operations.
We are subject to U.S. and foreign anti-money laundering and financial transparency laws that require implementation of regulations applicable to financial services companies, including standards for verifying client identification and monitoring client transactions and detecting and reporting suspicious activities. We offer investment and banking solutions that also are subject to regulation by the federal and state securities and banking authorities, as well as foreign regulatory authorities, where applicable. Existing or future regulations that affect these solutions could lead to a reduction in sales of these solutions or require modifications of these solutions.
We must comply with economic sanctions and embargo programs administered by the Office of Foreign Assets Control (OFAC) and similar national and multinational bodies and governmental agencies outside the United States, as well as anti-corruption and anti-money laundering laws and regulations throughout the world. We can incur higher costs and face greater compliance risks in structuring and operating our businesses to comply with these requirements. Furthermore, a violation of a sanction or embargo program or anti-corruption or anti-money laundering laws and regulations could subject us and our subsidiaries, and individual employees, to regulatory enforcement actions as well as significant civil and criminal penalties.
Our businesses are also subject to privacy and data protection information security legal requirements concerning the use and protection of certain personal information. These include those adopted pursuant to the Gramm-Leach-Bliley Act and the Fair and Accurate Credit Transactions Act of 2003 in the United States, the General Data Protection Regulation (GDPR) in the EU, Canada’s Personal Information Protection and Electronic Documents Act, the Cayman Islands' Data Protection Law, and various other laws. Privacy and data security legislation is a priority issue in many states and localities in the United States, as well as foreign jurisdictions outside of the EU. For example, California enacted the California Consumer Privacy Act (CCPA) which broadly regulates the sale of the consumer information of California residents and grants California residents certain rights to, among other things, access and delete data about them in certain circumstances. Other states are considering similar proposals. Such attempts by the states to regulate have the potential to create a patchwork of differing and/or conflicting state regulations. Ensuring compliance under ever-evolving privacy legislation, such as GDPR and CCPA, is an ongoing commitment, which involves substantial costs.
Compliance with existing and future regulations and responding to and complying with recent increased regulatory activity affecting broker-dealers, investment advisors, investment companies, financial institutions, and their service providers could have a significant impact on us. We periodically undergo regulatory examinations and respond to regulatory inquiries and document requests. In addition, recent and continuing legislative activity in the United States and in other jurisdictions (including the European Union and the United Kingdom) have made and continue to make extensive changes to the laws regulating financial services firms. As a result of these examinations, inquiries, and requests, as a result of increased civil litigation activity, and as a result of these new laws and regulations, we engage legal counsel and other subject matter experts, review our compliance procedures, solution and service offerings, and business operations, and make changes as we deem necessary or as may be required by the applicable authority. These additional activities and required changes may result in increased expense or may reduce revenues.
Our bank clients are subject to supervision by federal, state, and foreign banking and financial services authorities concerning the manner in which such clients purchase and receive our products and services. Our plan sponsor clients
7
and our subsidiaries providing services to those clients are subject to supervision by the Department of Labor and compliance with employee benefit regulations. Investment advisor and broker-dealer clients are regulated by the SEC, state securities authorities, or FINRA. Existing or future regulations applicable to our clients may affect our clients’ purchase of our products and services.
In addition, see the discussion of governmental regulations in Item 1A, Risk Factors for a description of the risks that the current regulatory regimes and proposed regulatory changes may present for our business. See also “Note 10. Commitments and Contingencies” included in our Notes to Consolidated Financial Statements for a more fulsome summary of our current regulatory matters with the FCA.
Item 1A. Risk Factors.
We believe that the risks and uncertainties described below are those that impose the greatest threat to the sustainability of our business. However, there are other risks and uncertainties that exist that may be unknown to us or, in the present opinion of our management, do not currently pose a material risk of harm to us. The risk and uncertainties facing our business, including those described below, could materially adversely affect our business, results of operations, financial condition, capital position, liquidity, competitive position or reputation, including by materially increasing expenses or decreasing revenues, which could result in material losses or a decrease in earnings.
Risks Related to Our Business Model
Our revenues and earnings are affected by changes in capital markets and significant changes in the value of financial instruments. A majority of our revenues are earned based on the value of assets invested in investment products that we manage or administer. A decrease in the value of these assets, whether due to general market movements or as a consequence of various products’ unique investment performance, would cause a decline in our assets under administration or management, and a corresponding decline in our revenue and earnings. And, in certain investment programs, a portion of our clients’ cash is swept into insured deposit accounts at third party banks on which we earn fees, which fees may be significant. A material change in interest rates or a significant number of clients opting out of these programs could affect our profitability. Significant fluctuations in securities prices may also influence an investor’s decision to invest in and maintain an investment in a mutual fund or other investment products. Declining or adverse economic conditions and adverse changes in investor, consumer and business sentiment generally result in reduced business activity, which may decrease the demand for our products and services. Geopolitical events, market volatility, illiquid market conditions and other disruptions in the financial markets may make it extremely difficult to value or monetize certain financial instruments, particularly during periods of market displacement. Subsequent valuations of financial instruments in future periods, in light of factors then prevailing, may result in significant changes in the value of these instruments. Additionally, periods of extreme market dislocation may require us to monetize our assets or those of our clients at a significant loss. As a result, our revenues and earnings derived from assets under management or administration, or our profitability or value as a firm, could be adversely affected.
We are exposed to product development risk. We continually strive to increase revenues and meet our customers' needs by introducing new products and services as well as maintaining and improving our existing products and services. As a result, we are subject to product development risk, which may result in loss if we are unable to develop and deliver products to our target markets that address our clients' needs, that are developed on a timely basis, or that reflect an attractive value proposition. The implementation of many product innovation and development opportunities, particularly cloud-based solutions, requires us to obtain client consent and/or vendor consent, which may be withheld or be obtainable only if we incur a cost that is disproportionate to the revenue opportunity. We are also subject to the risk that new products and solutions we develop may not function as expected or may be prone to error or disruption, which may result in material losses or harm to our reputation and ability to market such solutions. The majority of our technology product development risk pertains to the evolution of the SEI Wealth PlatformSM, TRUST 3000®, our platform for the Investment Managers segment, and our other proprietary technology platforms.
The development and introduction of new products and services in the markets in which we operate requires continued innovative efforts on our part and may require significant time and resources as well as ongoing support and investment. Expansion of Business-to-Consumer products and services presents unique risks as it increases direct interaction with individual consumers, exposing us to heightened cybersecurity threats and data privacy concerns. Growth in Business-to-Consumer models may increase operational risk due to higher transaction volumes, potentially increasing operational costs and fraud risks.
Product development in the asset management arena has experienced significant growth in alternative investments, including private equity, hedge funds, real estate, and infrastructure. The growing focus on alternatives reflects increasing demand for diversification beyond traditional asset classes; however, new alternative products often require three or more years in the market to generate the track records necessary to attract significant asset inflows. In addition, alternatives
8
present significant operational challenges for asset managers, primarily due to the lack of widely adopted and trusted technological solutions in this space. Unlike traditional investments, which benefit from well-established operational infrastructures and automated processes, alternative investments often require more manual intervention and bespoke operational support. Failure to effectively manage the risks associated with these new products could lead to reputational damage, regulatory scrutiny, and potential financial losses.
Product development in the asset management arena has had significant growth in newer areas where investment criteria and performance metrics have not yet been fully defined or developed, such as Tax Harvesting programs. New products often must be in the marketplace for three or more years in order to generate track records required to attract significant asset inflows. A failure to continue to innovate, to introduce successful new products and services, or to manage effectively the risks associated with such products and services, may impact our market share and may cause our revenues and earnings derived from assets under management and administration to decline.
We may not achieve significant revenue from new products or services for years, if at all. New products and services may not be profitable, and even if they are profitable, operating margins for some new products and services may not be as high as the margins we have experienced historically.
If we fail to develop new or enhanced products or services at an acceptable cost or on a timely basis, or if our development strategies are not accepted by our clients, we may recognize significant financial losses. Further, if we fail to deliver products and services which are of sound economic value to our clients and our target markets, or are unable to support the product in a cost-effective and compliant manner, we may face reputational damage and incur significant financial losses.
We rely on third parties to provide products and services that may be difficult to replace or which could cause errors or failures in the services we provide. We rely on third parties we do not control to provide us with products and services, including software development, licensed software, software as a service, business process outsourcing services, cloud services, hosting, web hosting, and the Automated Clearing House (ACH) network, which transmit transaction data, process chargebacks and refunds, and perform clearing services in connection with our settlement activities. In the event these third parties fail to provide these services adequately or in a timely manner, including as a result of errors in their systems or events beyond their control, or refuse to provide these services on terms acceptable to us or at all, and we are not able to find and implement timely suitable alternatives, we may no longer be able to provide certain services to customers, which could expose us and our clients to information security, financial, compliance and reputational risks, among others, and have a material adverse effect on our results of operations and financial condition. In addition, if we are unable to renew our existing contracts or licenses with key vendors, technology providers or service providers, we might not be able to replace the related product, application or service at all or at the same cost, which would negatively impact our offerings and our results of operations.
Pricing pressure from increased competition and disruptive technology may affect our revenues and earnings. The investment management industry is highly competitive and has relatively low barriers to entry. In recent years, we have experienced, and continue to experience, pricing pressures from the introduction of new, lower-priced investment products and services and the growth of passive investing, as well as from competitor firms offering automated portfolio management and other services based on technological innovations. Companies that successfully implement artificial intelligence (AI)-driven pricing could gain a significant advantage in optimizing revenues and responding to market dynamics. These new investment products and technological innovations, available to both institutional and retail investors, have led to a general trend towards lower fees in some segments of the investment management industry. We believe price competition and pricing pressures in these and other areas will continue as investors continue to reduce the amounts they are willing to pay and financial services firms seek to obtain market share by reducing fees or margins.
The competitive landscape is rapidly evolving with the entry of fintech firms and big tech companies into asset management. Our ability to compete effectively against these new entrants, who may have superior technological capabilities, is crucial for maintaining market share. Furthermore, these financial technology companies and other non-traditional competitors may not be subject to banking regulation, or may be supervised by a national or state regulatory agency that does not have the same resources or regulatory priorities as those regulatory agencies that supervise more diversified financial services firms such as us, or the financial services regulatory framework in a particular jurisdiction may favor financial institutions that are based in that jurisdiction. These types of differences in capabilities and regulatory status may result in losing market share to competitors that have a lower cost of compliance due to being less regulated than we are or not subject to regulation, especially with respect to unregulated financial products.
Over time, certain sectors of the financial services industry have become more concentrated, as institutions involved in a broad range of financial services have left businesses, been acquired by or merged into other firms, or have declared bankruptcy. Such changes could result in our remaining competitors gaining greater capital and other resources, such as the ability to offer a broader range of products and services and geographic diversity, or new competitors may emerge.
9
Our investment management platforms include investment management programs and back-office investment processing outsourcing services and are generally offered on a bundled basis. The breadth of our business solutions allows us to compete on a number of factors including:
•the performance of our investment products;
•the level of fees charged;
•the quality of our investment processing services;
•our reputation and position in the industry;
•our ability to adapt to disruptive technology developments or unforeseen market entrants; and
•our ability to address the complex and changing needs of our clients.
Increased competition on the basis of any of these factors could have an adverse impact on our competitive position resulting in a decrease in our revenues and earnings. Additionally, the trend toward direct access to automated, electronic markets will likely continue as additional markets move to more automated trading platforms. We have experienced and will likely continue to experience competitive pressures in these and other areas in the future.
Our outsourcing strategy may affect our business operations and financial performance. We have recently implemented a new outsourcing strategy that leverages a Global Capability Center (GCC) in India. While this strategy aims to enhance operational efficiency and access a skilled talent pool, it also introduces new risks that could materially affect our business operations and financial performance. The establishment and management of a GCC in India involves complex operational, regulatory, and compliance challenges. We may face difficulties in navigating local laws, cultural differences, and communication barriers, which could impede effective collaboration and oversight. Additionally, the GCC's operations may be subject to geopolitical risks, changes in local regulations, or economic instability in India, potentially disrupting our business processes or increasing operational costs. Our GCC relies heavily on local infrastructure and technology systems, which may be vulnerable to cybersecurity threats, natural disasters, or other disruptions. Any significant interruption in the GCC's operations could adversely affect our ability to deliver services to clients, potentially resulting in reputational damage and financial losses. Furthermore, the transfer of certain business functions to the GCC may involve the handling of sensitive data, raising concerns about data privacy and security. Despite our efforts to implement robust security measures, we cannot guarantee that our GCC will be immune to data breaches or cyber-attacks, which could expose us to legal liabilities and regulatory scrutiny.
The success of our GCC strategy depends on our ability to attract and retain skilled talent in India. However, the competitive labor market for technology professionals in India may lead to increased attrition rates or higher compensation costs, potentially eroding the cost benefits of our outsourcing strategy. Moreover, any failure to effectively integrate the GCC's operations with our global processes or to manage the quality of services provided by the GCC could negatively impact our operational efficiency and client satisfaction. If we are unable to realize the anticipated benefits of our GCC strategy or if we face significant challenges in its implementation and management, it could have a material adverse effect on our business operations, financial condition, and results of operations.
Our earnings and cash flows are affected by the performance of LSV. We maintain a minority ownership interest in LSV which is a significant contributor to our earnings. We also receive partnership distribution payments from LSV on a quarterly basis which contribute to our operating cash flows. LSV is a registered investment advisor that provides investment advisory services to institutions, including pension plans and investment companies. LSV is a value-oriented, contrarian money manager offering a deep-value investment alternative utilizing a proprietary equity investment model to identify securities generally considered to be out of favor by the market. Volatility in the capital markets or poor investment performance on the part of LSV, on a relative basis or an absolute basis, could result in a significant reduction in their assets under management and revenues and a reduction in performance fees. Consequently, LSV's contribution to our earnings through our minority ownership, as well as to our operating cash flows through LSV's partnership distribution payments, could be adversely affected.
Consolidation within our target markets may affect our business. Merger and acquisition activity within the markets we serve could reduce the number of existing and prospective clients or reduce the amount of revenue and earnings we receive from retained clients. Consolidation activities may also cause larger institutions to internalize some or all of our services. These factors may negatively impact our ability to generate future growth in revenues and earnings.
External factors affecting the fiduciary management market could adversely affect us. The utilization of defined benefit plans by employers in the United States, Canada and the United Kingdom has been steadily declining. A number of our clients have frozen or curtailed their defined benefit plans resulting in decreased revenues and earnings related to this market segment. We have also experienced increasing fee sensitivity and competition for certain fiduciary management services due to investor preferences toward lower-priced investment products including passive
10
management approaches. The current growth strategies of our Institutional Investors segment include entering new global markets and placing greater emphasis on defined contribution and not-for-profit organizations fiduciary management sales opportunities. These strategies may not be successful in mitigating the impact of lower revenues and earnings caused by these external factors which could adversely affect our revenues and earnings.
We may experience software defects, development delays or installation difficulties, which would harm our business and reputation and expose us to potential liability. A significant portion of our revenue is dependent upon our ability to develop, implement, maintain and enhance sophisticated software and computer systems. We may encounter delays when developing new applications and services. Further, the software underlying our services may contain undetected errors, vulnerabilities or defects when first introduced or when new versions are released. We may also experience difficulties in installing, integrating or supporting our technology on systems or with other programs used by our clients. Likewise, our clients may make a determination to delay or cancel the integration of our new applications and services. Defects in our software, failure to adequately maintain and enhance our software products, errors or delays in the processing of electronic transactions or other difficulties could result in interruption of business operations, delay in market acceptance, additional development and remediation costs, diversion of technical and other resources, loss of clients or client data, negative publicity or exposure to liability claims. Although we attempt to limit our potential liability through disclaimers and limitation of liability provisions in our license and client agreements, we cannot be certain that these measures will successfully limit our liability.
Risks Related to Our Technology
We are exposed to data and cyber security risks. Like other global financial service providers, we experience millions of cyber-attacks on our computer systems, software, networks and other technology assets on a daily basis. Cyber security and information risks for financial institutions have significantly increased in recent years in part because of the proliferation of new technologies, the use of the internet and mobile telecommunications technologies to conduct financial transactions, and the increased sophistication and activities of organized crime, hackers, terrorists and other external parties, including foreign state actors, in some circumstances as a means to promote political ends. In addition to the growing sophistication of certain parties, the commoditization of AI and cyber tools which are able to be weaponized by less sophisticated actors has led to an increase in the exploitation of technological vulnerabilities. Any of these parties may also attempt to fraudulently induce employees, customers, clients, vendors or other third parties or users of our systems to disclose sensitive information in order to gain access to our data or that of our employees or clients. Cyber security and information security risks may also derive from:
•human error,
•fraud, or malfeasance on the part of our employees or third parties,
•accidental technological failure, or
•our failure to introduce security patches provided by vendors in a timely manner.
In addition, third parties with whom we do business, their service providers, as well as other third parties with whom our customers do business, are sources of cyber security risk to us, particularly when their activities and systems are beyond our own security and control systems. A cyber-attack, information breach or loss, or technology failure of a third party could adversely affect our ability to effect transactions, service our clients, manage our exposure to risk, expand our businesses, or significantly harm our reputation. There is no guarantee that the strategies we have deployed that are designed to protect against threats and vulnerabilities will be effective or provide recoverability of our systems or our data or that of our clients given the techniques used in cyber-attacks are complex and frequently change.
A successful penetration or circumvention of the security of our systems or the systems of a vendor, governmental body or another market participant could cause serious negative consequences, including:
•significant disruption of our operations and those of our clients, customers and counterparties, including losing access to operational systems;
•misappropriation of our confidential information or that of our clients, counterparties, vendors, employees or regulators;
•damage to our technology infrastructure or systems and those of our clients, vendors and counterparties;
•inability to fully recover and restore data that has been stolen, manipulated or destroyed, or to prevent systems from processing fraudulent transactions;
•violations by us of applicable privacy and other laws;
•financial loss to us or to our clients, vendors, counterparties or employees;
11
•loss of confidence in our cyber security measures;
•dissatisfaction among our clients or counterparties;
•significant exposure to litigation and regulatory fines, penalties or other sanctions; and
•harm to our reputation.
Any of the foregoing factors could expose us to liability for damages which may not be covered by insurance; but may result in the loss of customer business, damage to our reputation, regulatory scrutiny or civil litigation.
The failure to upgrade or maintain our technology infrastructure including our, computer systems, software and networks could also make us susceptible to breaches, unauthorized access and misuse. We may be required to expend significant additional resources to modify, investigate or remediate vulnerabilities or other exposures arising from data and cyber security risks. Furthermore, even if not directed at us specifically, attacks on other financial institutions could disrupt the overall functioning of the financial system. As a result of the importance of communications and information systems to our business and our reliance on the services provided to us by third parties, we could also be adversely affected if attacks affecting our third-party service providers impair our ability to process transactions and communicate with clients and counterparties.
Given our extensive global operations, expansion through acquisitions, and the substantial volume of transactions we process daily, coupled with our vast network of clients, partners, vendors, and counterparties, we face an elevated risk of sophisticated and persistent cyber-attacks. The complexity of our systems and the evolving nature of cyber threats mean that a breach could potentially remain undetected for an extended period, potentially compromising sensitive data and disrupting critical operations. We expect that any investigation of a cyber-attack would be inherently unpredictable and that it would take time before the completion of any investigation and before there is availability of full and reliable information. During such time we would not necessarily know the extent of the harm or how best to remediate it, and certain errors or actions could be repeated or compounded before they are discovered and remediated, all or any of which would further increase the costs and consequences of a cyber-attack.
While many of our agreements with partners and third-party vendors include indemnification provisions, we may not be able to recover sufficiently, or at all, under such provisions to adequately offset any losses. In addition, although we maintain insurance coverage that may, subject to policy terms and conditions, cover certain aspects of cyber and information security risks, such insurance coverage may be insufficient to cover all losses.
Certain regulatory requirements, while aimed at enhancing cybersecurity, significantly restrict our ability to allocate resources based solely on our own risk assessments. The mandatory nature of these requirements, coupled with the potential for severe penalties for non-compliance, forces us to divert resources that might otherwise be allocated to areas we deem higher risk or more critical to our specific business needs.
We are exposed to risk of the disclosure and misuse of personal data. We store, transfer and process large amounts of personally identifiable information of our customers to deliver our products and services. It is possible our security controls over personal data, our training of employees on data security, our vendor due diligence and oversight processes, and other practices we follow may not prevent the improper disclosure or misuse of personal data that we or our vendors store and/or manage. Improper disclosure or misuse of personal data could harm our reputation, lead to legal exposure, or subject us to liability under laws that protect personal data, resulting in increased costs or loss of revenue. Perceptions that the collection, use, and retention of personal information is not satisfactorily protected could inhibit sales of our products or services. Additional security measures we may take to address customer concerns may cause higher operating expenses or hinder growth of our products and services.
We are exposed to risk of outages, data losses, and disruptions of services. We maintain and process data for our clients that is critical to their business operations. The products and services used to process that data is increasingly complex, and maintaining, securing, and expanding this infrastructure is expensive. It requires that we maintain an Internet connectivity infrastructure and storage and compute capacity that is robust and reliable within competitive and regulatory constraints that continue to evolve. Inefficiencies or operational failures, including temporary or permanent loss of customer data, damaged software codes, delayed or inaccurate processing of transactions, insufficient Internet connectivity, or inadequate storage and compute capacity, could diminish the quality of our products, services, and user experience resulting in contractual liability, claims by customers and other third parties, regulatory actions, damage to our reputation, and loss of current and potential users, each of which may adversely impact our consolidated financial statements. The costs necessary to rectify these problems may be substantial and may adversely impact our business.
The trend toward direct access to automated, electronic markets and the move to more automated trading platforms has resulted in the use of increasingly complex technology that relies on the continued effectiveness of the programming code and integrity of the data to process the trades. We rely on the ability of our employees, our consultants, our internal
12
systems and third-party systems to operate our different businesses and process a high volume of transactions. Unusually high trading volumes or site usage could cause our systems to operate at an unacceptably slow speed or even fail. Disruptions to, destruction of, instability of or other failure to effectively maintain our information technology systems or external technology that allows our clients and customers to use our products and services could harm our business and our reputation. There can be no assurance that our business contingency and security response plans fully mitigate all potential risks to us.
We are exposed to intellectual property risks. Our continued success also depends in part on our ability to protect our proprietary technology and solutions and to defend against infringement claims of others. We primarily rely upon trade secret law, software security measures, copyrights and confidentiality restrictions in contracts with employees, vendors and customers. Our industry is characterized by the existence of a large number of trade secrets, copyrights and the rapid issuance of patents, as well as frequent litigation based on allegations of infringement or other violations of intellectual property (IP) rights of others. A successful assertion by others of infringement claims or a failure to maintain the confidentiality and exclusivity of our intellectual property may have a material adverse effect on our business and financial results.
The success of our merger and acquisition (M&A) activity and strategy also depends on our ability to protect our proprietary technology and solutions, defend against infringement claims, and effectively manage intellectual property assets acquired through M&A activities. Failure to maintain the confidentiality and exclusivity of our intellectual property, or inadequate due diligence in M&A transactions may have a material adverse effect on our business and financial results. Additionally, the complexity of IP issues in M&A deals may impact our ability to close transactions or realize their full value.
We are dependent upon third-party service providers in our operations. In connection with our ongoing operations, we utilize the services of third-party suppliers, which we anticipate will continue and may increase in the future. These services include, for example, outsourced development, processing and support functions, and other professional services.
Third-party financial entities and technology systems upon which we rely are becoming more interdependent and complex. For example, in recent years, there has been significant consolidation among clearing agents, exchanges and clearing houses and increased interconnectivity of multiple financial institutions with central agents, exchanges and clearing houses. This consolidation and interconnectivity increases the risk of operational failure, on both an individual and industry-wide basis, as disparate complex systems need to be integrated, often on an accelerated basis.
A failure by a third-party product or service provider may impair our ability to provide contractual services to our clients on a timely basis, to process transactions for our clients accurately, or to meet our regulatory obligations. If a third-party service provider is unable to provide services, we may incur significant costs to either internalize some of these services, find a suitable alternative, or to compensate our clients for any losses that may be sustained as a consequence of the actions or inactions of our third-party services providers. In the event of a breakdown or improper operation of a direct or indirect third-party’s systems or processes, or improper or unauthorized action by third parties, including consultants and subcontractors, we could suffer financial loss, a disruption of our businesses, regulatory sanctions or damage to our reputation.
We are at risk of failing to keep pace with significant new technologies. The financial services industry is undergoing rapid technological change, and financial institutions and fintech companies are investing significantly in new and disruptive technologies, such as artificial intelligence, machine learning, blockchain and other distributed ledger technologies. The failure to develop new solutions or enhancements to our existing solutions that incorporate or interact with new technologies, or doing so at a slower pace than our competition, could cause our solutions to be less competitive and adversely impact our business. Further, such technologies are complex and changing rapidly, and there are technical challenges associated with achieving desired levels of accuracy, efficiency, and reliability. The algorithms and models used may have limitations, including biases, errors, or inability to handle certain data types or scenarios. Furthermore, the use of new technologies introduces additional risks of system failures, disruptions, or vulnerabilities that could compromise the integrity, security, or privacy of data. These limitations or failures could result in reputational damage, legal liabilities, or loss of user confidence.
Risks Related to Our Investment Products and Solutions
Our investment management business may be affected by the poor investment performance of our investment products or a client preference for products other than those which we offer or for products that generate lower fees. Poor investment returns in our investment management business, due to either general market conditions or underperformance (relative to our competitors or to benchmarks) by funds or accounts that we manage or investment products that we design or sell, affects our ability to retain existing assets and to attract new clients or additional assets from existing clients and could affect the management and incentive fees that we earn on assets under management. To the extent that our clients choose to invest in products that we do not currently offer, we will suffer outflows and a loss of
13
management fees. Further, if, due to changes in investor sentiment or the relative performance of certain asset classes or otherwise, clients invest in products that generate lower fees, our investment management business could be adversely affected.
Our investment management business may be affected by the performance of our AI-driven investment strategies, changing client preferences for sustainable and digital assets, and the increasing demand for hyper-personalized solutions. Poor investment returns, whether due to market conditions or underperformance relative to AI-powered competitors or ESG benchmarks, could impact our ability to retain assets and attract new clients.
The rise of alternative investments, including private credit and infrastructure, presents both opportunities and risks. Failure to effectively integrate these assets into our offerings could lead to outflows as clients seek diversification beyond traditional asset classes.
Poor investment performance could lead to the loss of clients and may cause AUM, revenue and earnings to decline. Investment performance is one of the most important factors for the growth and retention of AUM. Poor investment performance relative to applicable portfolio benchmarks or competitors may cause AUM, revenue and earnings to decline as a result of client withdrawals in favor of better performing products offered by competitors or diminished ability to attract additional funds from existing and new clients.
Failure to identify errors in quantitative investment models could adversely affect product performance and client relationships. We employ quantitative models to support certain of our investment processes, including with respect to risk assessment and portfolio management. Any errors or limitations in these models, including model inputs or assumptions, as well as any failure of our governance and validation in respect of such models, the failure to timely update such models, or errors in how such models are used, could have adverse effects on our business and reputation.
Our investment advisory contracts may be terminated or may not be renewed on favorable terms. We derive a substantial portion of our revenue from providing investment advisory services. The advisory or management contracts we have entered into with clients, including the agreements that govern many of SEI’s investment funds, provide investors or, in some cases, the independent directors of applicable investment funds, with significant latitude to terminate such contracts, withdraw funds or liquidate funds with limited notice or penalty. We also manage U.S. mutual funds under management contracts that must be renewed and approved annually by the funds’ respective boards of trustees, a majority of whom are independent from SEI. Our fee arrangements under any advisory or management contracts may be reduced (including at the behest of a fund’s board of trustees). In addition, if a number of our clients terminate their contracts, liquidate funds or fail to renew management contracts on favorable terms, the fees we earn could be reduced, which may cause our assets under management, revenue and earnings to decline.
We rely on the services of third-party sub-advisers. We serve as the investment advisor for many of the products offered through our investment management programs and utilize the services of investment sub-advisers to manage the majority of these assets. A failure in the performance of our due diligence processes and controls related to the supervision and oversight of these firms, as well as errors, fraudulent activity, or noncompliance with relevant securities and other laws and regulations by those firms, could cause us to suffer financial loss, regulatory sanctions or damage to our reputation.
We are dependent upon third-party approvals. Many of the investment advisors through which we distribute our investment offerings are affiliated with independent broker-dealers or other networks, which have regulatory responsibility for the advisor’s practice. As part of the regulatory oversight, these broker-dealers or networks must approve the use of our investment products by affiliated advisors within their networks. Failure to receive such approval, or the withdrawal of such approval, could adversely affect the marketing of our investment products.
We are dependent on third-party pricing services for the valuation of securities invested in our investment products. The majority of the securities held by our investment products are valued using quoted prices from active markets gathered by external third-party pricing services. Securities for which market prices are not readily available are valued in accordance with procedures applicable to that investment product. These procedures may utilize unobservable inputs that are not gathered from any active markets and involve considerable judgment. If these valuations prove to be inaccurate, our revenues and earnings from assets under management could be adversely affected.
Risks Related to Our Legal, Regulatory and Compliance Environment
The financial services industry is subject to extensive regulations that impact our business. Legal, regulatory and compliance risk includes the risk of legal or regulatory sanctions, material financial loss including fines, penalties, judgments, damages and/or settlements, or loss to reputation we may suffer as a result of our failure to comply with laws, regulations, rules, related self-regulatory organization standards and codes of conduct applicable to our business activities. This risk also includes contractual and commercial risk, such as the risk that a counterparty’s performance
14
obligations will be unenforceable. It also includes compliance with privacy, anti-money laundering (AML), anti-corruption and terrorist financing rules and regulations.
As a major financial services firm, we are subject to extensive regulation by U.S. federal and state regulatory agencies and securities exchanges and by regulators and exchanges in each of the major markets where we conduct our business. Our parent company, SEI Investments Company, is regulated by the FFIEC as a significant service provider to the financial industry and subject to SEC oversight as a publicly traded company. Our various business activities in the United States are conducted through entities such as an investment advisor, broker-dealer, commodity pool operator, swap dealer, transfer agent, investment company, national bank and trust company which may be registered with or regulated by the SEC, FINRA, CFTC, NFA, DOL, OCC, and the PA Department of Banking. In addition, some of our foreign subsidiaries are registered with, and subject to the oversight of, regulatory authorities primarily in the United Kingdom, Ireland, Canada, Luxembourg, South Africa, and the Cayman Islands. Many of our clients are subject to substantial regulation by federal and state banking, securities, insurance or employee benefit authorities. Compliance with existing and future regulations, responding to and complying with regulatory activity (new requirements, examinations and supervisory activity) affecting our financial intermediary clients and their service providers could have a significant impact on our operations or business or our ability to provide certain products or services or could adversely impact a portfolio’s ability to achieve its investment strategies or make certain investments.
We offer financial services technology products and services that also are subject to regulation by the federal and state securities and banking authorities, as well as foreign regulatory authorities, where applicable. Existing or future regulations that affect these products could lead to a reduction in sales of these products or an increase in the cost of providing these products. There can also be significant differences in the ways that similar regulatory initiatives affecting the financial services industry are implemented in the United States and in other countries. For example, regulations like the EU's Digital Operational Resilience Act (DORA) are intended to implement a global regulatory standard, may introduce additional or more restrictive requirements for non-EU affiliates, which can create competitive disadvantages for multi-jurisdictional operations. In addition, the regulatory environment is increasingly influenced by geopolitical factors and technological advancements. For instance, the implementation of Basel 3.1 in the United Kingdom has been delayed, partly due to uncertainties in the US regulatory landscape. The interconnectedness of global financial markets means that regulatory initiatives often have cross-border implications. Firms must navigate potential regulatory divergences and the related tensions and irreconcilable policies between jurisdictions, which can create regulatory risk, operational challenges and competitive dynamics.
In the United States, the Bank Secrecy Act, as amended by the USA PATRIOT Act of 2001 and the Anti-Money Laundering Act of 2020, imposes significant obligations on financial institutions to detect and deter money laundering and terrorist financing activity, including requiring banks, bank holding companies and their subsidiaries, broker-dealers, futures commission merchants, introducing brokers and mutual funds to implement anti-money laundering programs, verify the identity of customers that maintain accounts, and monitor and report suspicious activity to appropriate law enforcement or regulatory authorities. Recent regulatory developments have also introduced new obligations for registered investment advisers (RIAs), aligning them with other financial institutions under AML frameworks. RIAs must now establish formal AML programs with written policies, a designated compliance officer, ongoing training, and independent testing which extends our AML obligations to subsidiaries that were previously not require to maintain a standalone AML Program.
Outside the United States, applicable laws, rules and regulations similarly require designated types of financial institutions to implement compliance programs to address regulatory requirements related to money laundering, financial crime and the financing of terrorist activities. Failure to implement comprehensive anti-money laundering programs across our globally-regulated businesses poses regulatory risk including fines for noncompliance.
We are also subject to sanction regulations, such as regulations and economic sanctions programs administered by the U.S. government, including the U.S. Treasury Department’s Office of Foreign Assets Control (OFAC) and the U.S. Department of State, and similar sanctions programs imposed by foreign governments or global or regional multilateral organizations. In addition, we are subject to anti-corruption laws, such as the U.S. Foreign Corrupt Practices Act and the U.K. Bribery Act, in the jurisdictions in which we operate. Anti-corruption laws generally prohibit offering, promising, giving or authorizing others to give anything of value, either directly or indirectly, to a government official or private party in order to influence official action or otherwise gain an unfair business advantage, such as to obtain or retain business. We can incur higher costs and face greater compliance risks in structuring and operating our businesses to comply with these requirements. Furthermore, a violation of a sanction or embargo program or anti-corruption or anti-money laundering laws and regulations could subject us and our subsidiaries, and individual employees, to regulatory enforcement actions as well as significant civil and criminal penalties.
Our businesses are also subject to privacy and data protection information security legal requirements concerning the use and protection of certain personal information. These include those adopted pursuant to the Gramm-Leach-Bliley Act and
15
the Fair and Accurate Credit Transactions Act of 2003 in the United States, the General Data Protection Regulation (GDPR) in the EU, Canada’s Personal Information Protection and Electronic Documents Act, the Cayman Islands' Data Protection Law, and various other laws. Privacy and data security legislation is a priority issue in many states and localities in the United States, as well as foreign jurisdictions outside of the EU. These laws impose mandatory privacy and data protection obligations, including providing for individual rights, enhanced governance and accountability requirements and significant fines and litigation risk for noncompliance. Many other jurisdictions have adopted or are proposing to adopt standards similar to the GDPR. In addition, several jurisdictions have enacted or proposed personal data localization requirements and restrictions on cross-border transfer of personal data that may restrict our ability to conduct business in those jurisdictions or create additional financial and regulatory burdens to do so.
Many aspects of our businesses are subject to legal requirements concerning the use and protection of certain customer information. These include those adopted pursuant to the Gramm-Leach-Bliley Act and the Fair and Accurate Credit Transactions Act of 2003 in the United States, as well as the privacy and cybersecurity laws referenced above. We have adopted measures designed to comply with these and related applicable requirements in all relevant jurisdictions. Well-publicized allegations involving the misuse or inappropriate sharing of personal information have led to expanded governmental scrutiny of practices relating to the use or sharing of personal data by companies in the United States and other countries. That scrutiny has in some cases resulted in, and could in the future lead to, the adoption of stricter laws and regulations relating to the use and sharing of personal information. These types of laws and regulations could prohibit or significantly restrict financial services firms from sharing information among affiliates or with third parties such as vendors, and thereby increase compliance costs, or restricting the use of personal data when developing or offering products or services to customers. These restrictions could inhibit our development or marketing of certain products or services, or increase the costs of offering them to customers.
Compliance with existing and emerging regulations, as well as responding to regulatory examinations and supervisory activities, continues to have a significant impact on our operations globally. This includes, without limitation, adapting to new requirements for consumer protection, operational resilience, and sustainable finance. The fees, assessments and operational restrictions that may be imposed on our regulated subsidiaries by federal, national, state, and foreign regulatory authorities could have a significant impact on us, including, without limitation, materially affecting our ability to do business and generated revenue in a particular jurisdiction. The frequency and scope of regulatory reform in the current regulatory environment may lead to an increase in fees, assessments and operational restrictions resulting in increased expense, or an increase or change in regulatory requirements which could affect our operations and business. Moreover, maintaining adequate staffing levels to address these evolving regulatory demands presents an ongoing challenge. The complexity and volume of new regulations require specialized expertise, and there is a risk that we may face difficulties in attracting, retaining, and training qualified personnel to manage compliance effectively. Insufficient staffing in compliance and risk management roles could expose us to regulatory breaches, financial penalties, and reputational damage. As regulatory requirements continue to evolve rapidly, particularly in areas such as operational resilience, second line functions, ESG reporting, cybersecurity, and digital asset management, the pressure on our human resources to keep pace with these changes remains a significant operational risk.
A failure to address conflicts of interest appropriately could adversely affect our business and reputation. As a global financial services firm that provides products and services to a diversified group of clients, including public and private entities, financial institutions and individuals, we face potential conflicts of interest in the normal course of business. For example, potential conflicts can occur when there is a divergence of interests between us and a client, among clients, between an employee on the one hand and us or a client on the other, or situations in which we may be a creditor of a client. Moreover, we utilize multiple business channels, including those resulting from our acquisitions, and continue to enhance the collaboration across business segments, which may heighten the potential conflicts of interest or the risk of improper sharing of information. We have policies, procedures and controls that are designed to identify and address potential conflicts of interest, and we utilize various measures, such as the use of disclosure, to manage these potential conflicts. However, identifying and mitigating potential conflicts of interest can be complex and challenging and can become the focus of media and regulatory scrutiny. The regulatory landscape has evolved, with bodies like the SEC placing greater emphasis on conflicts disclosure, particularly for dual registrants and advisers with affiliated broker-dealers. It is possible that potential conflicts could give rise to litigation or enforcement actions, which may lead to our clients being less willing to enter into transactions in which a conflict may occur and could adversely affect our businesses and reputation. The global nature of our operations also means we must navigate potentially conflicting regulatory requirements across different jurisdictions, adding another layer of complexity to our conflict management efforts.
Our investment management operations may subject us to legal liability for client losses. Our fund and trust management and administration operations are complex activities and include functions such as recordkeeping and accounting, security pricing, corporate actions processing, compliance with investment restrictions, daily net asset value computations, account reconciliations, and required distributions to fund shareholders. Failure to properly perform operational tasks or the misrepresentation of our services and products could subject us to regulatory sanctions, penalties
16
or litigation and result in reputational damage, liability to clients, and the termination of investment management or administration agreements and the withdrawal of assets under our management.
In the management and administration of funds and client accounts, we use models and other tools and resources to support investment decisions and processes, including those related to risk assessment, portfolio management, trading and hedging activities and product valuations. Errors in the design, function, or underlying assumptions used in these models and tools, particularly if we fail to detect the errors over an extended period, could subject us to claims of a breach of fiduciary duty and potentially large liabilities for make-whole payments, litigation, and/or regulatory fines.
We are subject to litigation and regulatory examinations and investigations. The financial services industry faces substantial regulatory risks and litigation. Like many firms operating within the financial services industry, we are experiencing a difficult and continuously evolving regulatory environment across our markets and jurisdictions in which we operate. Our current scale and reach as a provider to the financial services industry, the increased regulatory oversight of the financial services industry generally, new laws and regulations affecting the financial services industry and ever-changing regulatory interpretations of existing laws and regulations, have made this an increasingly challenging and costly regulatory environment in which to operate.
Examinations or investigations could result in the identification of matters that may require remediation activities or enforcement proceedings by the regulator. Regulators in the jurisdictions in which we operate are increasingly focused on the experience and staffing levels of control functions, technology infrastructure and operational resilience, areas which can be more costly and specialized to remediate and deviate from the types of regulatory remediations we are accustomed to. This shift in regulatory focus may require substantial investments in advanced technologies and specialized expertise to ensure compliance. The direct and indirect costs of responding to these examinations, undertaking remediation activities or of defending ourselves in any enforcement investigation or litigation could be significant. Additionally, actions brought against us may result in settlements, awards, injunctions, fines, penalties and operational changes. Litigation or regulatory action could also harm our reputation with clients and prospects, have an adverse effect on our ability to offer some of our products and services, or impede our ability to maintain operations in certain jurisdictions. Moreover, the increasing complexity of regulatory requirements, especially in areas like AI governance and cybersecurity, may lead to higher compliance costs and operational challenges. Failure to adequately address these emerging regulatory priorities could result in significant financial and reputational damage
Risks Related to Our Business Generally
We may be unable to fully capture the expected value from acquisitions, divestitures, joint ventures, minority stakes or strategic alliances. In connection with past or future acquisitions, divestitures, joint ventures, minority stakes or strategic alliances, we face numerous risks and uncertainties combining, transferring, separating or integrating the relevant businesses, systems and personnel, including the need to combine or separate accounting and data processing systems and management controls and to integrate relationships with clients, trading counterparties and business partners. In the case of joint ventures and minority stakes, we are subject to additional risks and uncertainties because we may be dependent upon, and subject to liability, losses or reputational damage relating to systems, controls and personnel that are not under our control.
In addition, conflicts or disagreements between us and any of our joint venture, strategic or minority partners may negatively impact the benefits to be achieved by the relevant venture.
There is no assurance that any of our acquisitions or divestitures will be successfully integrated or disaggregated or that any of these transactions or our joint ventures, minority stakes or strategic alliances will yield the anticipated benefits, synergies or objectives. If we are not able to integrate or disaggregate successfully our past and future acquisitions or dispositions, or we do not fully realize the anticipated benefits, synergies or objectives of the transactions that we undertake, there is a risk that our results of operations, financial condition and cash flows may be materially and adversely affected.
In addition, acquisitions that expand our geographic footprint often involve additional or increased risks that we may not mitigate, which, in turn could adversely affect our operations and profitability. These risks include, for example:
•managing geographically separated organizations, systems and facilities;
•integrating personnel with diverse business backgrounds and organizational cultures;
•complying with non-U.S. regulatory requirements;
•fluctuations in currency exchange rates;
•enforcement of intellectual property rights in some non-U.S. countries;
17
•difficulty entering new non-U.S. markets due to, among other things, consumer acceptance and business knowledge of these new markets; and
•general economic and political conditions.
Growth of our business could increase costs and regulatory risks. Providing platforms for existing and new businesses, expanding our operational services, integrating acquired businesses, and partnering with other firms involves a number of risks and present financial, managerial, and operational challenges. We may incur significant expenses in connection with further expansion of our existing businesses or in connection with strategic acquisitions or investments, if and to the extent they arise from time to time. Our overall profitability would be negatively affected if investments and expenses associated with such growth are not matched or exceeded by the revenues that are derived from such investment or growth. As we expand our business-to-consumer offerings, we face heightened cybersecurity and fraud risks. The rapid growth in digital payments introduces increased threats of data breaches, identity theft, and sophisticated hacking attempts. These risks could lead to significant financial losses and reputational damage if not adequately addressed. Expansion may also create a need for additional compliance, risk management and internal control procedures, and often involves the hiring of additional personnel to monitor such procedures. To the extent such procedures are not adequate to appropriately monitor any new or expanded business, we could be exposed to a material loss or regulatory sanction.
Moreover, to the extent we pursue strategic acquisitions, we may be exposed to a number of risks, including additional demands on our existing employees; additional or new regulatory requirements, operating facilities and technologies; adverse effects in the event acquired goodwill or intangible assets become impaired; and the existence of liabilities or contingencies not disclosed to or otherwise known by us prior to closing a transaction.
The expansion of services in subsidiaries that do not have a primary regulator but are still supervised as part of the SEC-regulated public company and the FFIEC from a technology governance perspective presents unique challenges. These entities may face increased scrutiny and potential regulatory gaps, as they fall under the umbrella of consolidated supervision. Our technology infrastructure and operations must align with these regulatory expectations, which may require significant investments and operational changes as regulation in this space continues to evolve. Our corporate governance structure and enterprise risk functions are replied upon to mitigate and control these risks.
Certain of our business initiatives, including expansions of existing businesses, may bring us into contact, directly or indirectly, with individuals and entities that are not within our traditional client and counterparty base and may expose us to new asset classes and new markets. These business activities could expose us to new and enhanced risks, greater regulatory scrutiny of these activities, increased credit-related, political and operational risks, and reputational concerns regarding the manner in which these assets are being administered or held.
These risks could result in decreased earnings and harm to our competitive position in the investment management industry. Additionally, failure to effectively manage these risks could lead to regulatory sanctions, financial losses, and damage to our reputation in an increasingly competitive and rapidly evolving financial services landscape.
We are exposed to operational risks. We are subject to the risk of loss, or of harm to our reputation, resulting from manual, inadequate or failed processes or systems. We are exposed to operational risk across the full scope of our business activities, including revenue-generating activities (e.g., sales and trading) and support and control groups (e.g., information technology, accounting systems and trade processing).
Our businesses are highly dependent on our ability to process and report, on a daily basis, a large number of transactions across numerous and diverse markets and asset classes in many currencies. Operational efficiency is modeled on defined and strict timelines which present inherent risk. Our operations rely on the competence and trustworthiness of our employees and consultants, as well as of our contractors and third parties, including vendors, custodians and financial intermediaries. Should we experience any significant operational breakdown or failure, theft, fraud or other unlawful conduct, or other negative outcomes caused by poor judgment, human error or misconduct on the part of one of our employees or contractors or those of a third party on which our operations rely, we could suffer significant financial loss, regulatory sanctions or damage to our reputation. Additionally, we may introduce new products or services or change processes or reporting, including in connection with new regulatory requirements, resulting in new operational risk that we may not fully appreciate or identify.
The expansion of our GCC and the outsourcing of technology and global operations functions currently performed onshore introduce additional risks. Outsourcing to the GCC may lead to a loss of direct control over critical business functions and create dependencies on third-party providers. This could result in unexpected service disruptions, particularly if the GCC faces technical failures or operational challenges. The distance and potential cultural differences may also complicate communication and oversight, potentially leading to missed deadlines or mistakes that could subject us to claims or regulatory scrutiny.
18
Notwithstanding evolving technology and technology-based risk and control systems, our products and services ultimately rely on people, including our employees and those of third-parties with which we conduct business. As a result of human error or engagement in violations of applicable policies, laws, or procedures, certain errors or violations are not always discovered immediately by our controls, which are intended to prevent and detect such errors or violations. These can include calculation or input errors, inadvertent or duplicate payments, errors in software or model development or implementation, or errors in judgment, as well as intentional efforts to disregard or circumvent applicable policies, laws, rules or procedures. Human errors and malfeasance, even if promptly discovered and remediated, can result in material losses and liabilities for us.
We have devoted significant resources to develop our risk management capabilities and expect to continue to do so in the future. Nonetheless, our risk management strategies, models and processes, including our use of various risk models for assessing market, credit, liquidity and operational exposures and other analysis, may not be fully effective in mitigating our risk exposure in all market environments or against all types of risk, including risks that are unidentified or unanticipated.
The primary responsibility for the management of operational risk is with the business segments; the business managers maintain processes and controls designed to identify, assess, manage, mitigate and report operational risk. Oversight of operational risk is provided by the Enterprise Risk Management function, the Enterprise Risk Committee, legal entity boards, jurisdictional risk officers, committees and senior management. This governance structure may not adequately assess or address operational risk, which could lead to significant financial loss and reputational harm.
Disruptions of operations of other participants in the global financial system could prevent us from delivering our products and services. The operations and systems of many participants in the global financial system are interconnected. Many of the transactions involving our products and services rely on multiple participants in the global financial system to move funds and communicate information to the next participant in the transaction chain. A disruption for any reason of the operations of a participant in the global financial system could impact our ability to obtain or provide information or cause funds to be moved in a manner to successfully deliver our products and services. Although we work with other participants to avoid any disruptions, there is no assurance that such efforts will be effective. Such a disruption could lead to our inability to deliver products and services, reputational damage, lost clients and revenue, loss of clients’ and their customers’ confidence, as well as additional costs, all of which could have a material adverse effect on our business, results of operations and financial condition.
We are a holding company and, therefore, may not be able to receive dividends or other payments in needed amounts from our subsidiaries. We are organized as a holding company, a legal entity separate and distinct from our operating entities. As a holding company without significant operations of its own, our principal assets are the shares of capital stock of our subsidiaries. We rely on dividends and other payments from these subsidiaries to meet our obligations for paying dividends to shareholders, repurchasing our common stock and paying corporate expenses. Certain of our subsidiaries are subject to regulatory requirements of the jurisdictions in which they operate or other restrictions that may limit the amounts those subsidiaries can pay in dividends or other payments to us. No assurance can be given that there will not be further changes in law, regulatory actions, or other circumstances that could restrict the ability of our subsidiaries to pay dividends or otherwise make payment to us. Furthermore, no assurance can be given that our subsidiaries may be able to make timely payments to us in order for us to meet our obligations.
Changes in, or interpretation of, accounting principles could affect our revenues and earnings. We prepare our consolidated financial statements in accordance with generally accepted accounting principles. A change in these principles can have a significant effect on our reported results and may even retrospectively affect previously reported results (See Note 1 to the Consolidated Financial Statements for more information).
Changes in, or interpretations of, tax rules and regulations may adversely affect our effective tax rates. Unanticipated changes in our tax rates could affect our future results of operations. Our future effective tax rates could be adversely affected by changes in tax laws or the interpretation of tax laws. We are subject to possible examinations of our income tax returns by the Internal Revenue Service and state and foreign tax authorities. We regularly assess the likelihood of outcomes resulting from these examinations to determine the adequacy of our provision for income taxes; however, there can be no assurance that the final determination of any examination will not have an adverse effect on our operating results or financial position.
Currency fluctuations could negatively affect our future revenues and earnings as our business grows globally. We operate and invest globally to expand our business into foreign markets. Our foreign subsidiaries use the local currency as the functional currency. As these businesses evolve, our exposure to changes in currency exchange rates may increase. Adverse movements in currency exchange rates may negatively affect our operating results, liquidity, contract values and financial condition.
Changes in interest rates may affect the value of our fixed-income investment securities. We own Government National Mortgage Association (GNMA) mortgage-backed securities for the sole purpose of satisfying applicable
19
regulatory requirements imposed on our wholly-owned limited purpose federal thrift subsidiary, SPTC. The valuations of these securities are impacted by fluctuations in interest rates. The effect of a rising interest rate environment may negatively impact the value of these securities and thereby negatively affect our financial position and earnings.
We are subject to financial and non-financial covenants which may restrict our ability to manage liquidity needs. Our $325.0 million five-year senior unsecured revolving credit facility (Credit Facility) contains financial and non-financial covenants. The non-financial covenants include restrictions on our ability to execute transactions with affiliates other than wholly-owned subsidiaries or to incur liens or certain types of indebtedness as defined in the agreement. In the event of default, we have restrictions on paying dividends and repurchasing our common stock. We have one financial covenant, the Leverage Ratio, which restricts the level of indebtedness we can incur to a maximum of 2.25 times earnings before interest, taxes, depreciation and amortization (EBITDA). We believe our primary risk is with the financial covenant if we were to incur significant unexpected losses that would impact the EBITDA calculation. This would increase the Leverage Ratio and restrict the amount we could borrow under the Credit Facility. A restriction on our ability to fully utilize our Credit Facility may negatively affect our operating results, liquidity and financial condition.
We may become subject to stockholder activism efforts that each could cause material disruption to our business. Industry trends indicate activists are targeting operational enhancements and strategic demands, with a notable increase in CEO scrutiny. The global expansion of activism increases risks for multinational companies. Large institutional investors are more actively engaging in governance issues, often supporting or initiating activist campaigns. This evolving landscape, coupled with ongoing regulatory changes, has led companies to a higher likelihood of becoming subject to stockholder activism, potentially leading to more significant disruptions to business operations and strategy. The costs and diversion of management attention could be more substantial, and the impact on stock prices more pronounced.
If we become subject to such stockholder activism efforts, it could result in substantial costs and a diversion of management's attention and resources, which could harm our business and adversely affect the market price of our common stock. In addition, third party organizations that place ESG ratings on companies may create brand impact as a result of a rating that we do not control.
We rely on our executive officers and senior management. Most of our executive officers and senior management personnel do not have employment agreements with us. The loss of these individuals may have a material adverse effect on our future operations.
We may incur losses if our risk management and business continuity strategies, models and processes are not fully effective in mitigating our risk exposures in all market environments or against all types of risk. We seek to monitor and control our risk exposure through a risk and control framework encompassing a variety of separate but complementary financial, credit, operational, compliance and legal reporting systems, internal controls, management review processes and other mechanisms. Our risk management process seeks to balance our ability to profit from our business activities, with our exposure to potential losses and liabilities. While we employ a broad and diversified set of risk monitoring and risk mitigation techniques, those techniques and the judgments that accompany their application cannot anticipate every economic and financial outcome or the specifics and timing of such outcomes. As our businesses change and grow, and the markets in which we operate evolve, our risk management strategies, models and processes may not always adapt with those changes. Some of our methods of managing risk are based upon our use of observed historical market behavior and management’s judgment. As a result, these methods may not predict future risk exposures, which could be significantly greater than the historical measures indicate. In addition, the use of models in connection with risk management and numerous other critical activities presents risks that such models may be ineffective, either because of poor design or ineffective testing, improper or flawed inputs, as well as unpermitted access to such models resulting in unapproved or malicious changes to the model or its inputs. Market conditions in recent years have involved unprecedented dislocations and highlight the limitations inherent in using historical data to manage risk. Thus, we may, in the course of our activities, incur losses.
Despite the business contingency, disaster recovery and security response plans we have in place, there can be no assurance that such plans will fully mitigate all potential risks to us. Our ability to conduct business may be adversely affected by a disruption in the infrastructure that supports our business and the communities where we are located, which are concentrated in the Philadelphia metropolitan area, London and Dublin. This may include a disruption involving physical site access, cyber or information security incidents, terrorist activities, disease pandemics, catastrophic events, natural disasters, severe weather events, electrical outage, environmental hazard, computer servers, communications or other services used by us or third parties with whom we conduct business.
Although we employ backup systems for our data, those backup systems may be unavailable following a disruption, the affected data may not have been backed up or may not be recoverable from the backup, or the backup data may be costly to recover, which could adversely affect our business.
20
We may incur losses as a result of unforeseen or catastrophic events, including the emergence of a pandemic, extreme weather events or other natural disasters. The occurrence of unforeseen or catastrophic events, including the emergence of a pandemic, extreme terrestrial or solar weather events or other natural disasters, could create economic and financial disruptions, and could lead to operational difficulties (including travel limitations) that could impair our ability to manage our businesses and may adversely affect our operations, financial condition, and results of operations.
The extent to which an event negatively affects our businesses, results of operations and financial condition, as well as its regulatory capital and liquidity ratios, will depend on future developments that are uncertain and cannot be fully predicted, including:
•the ultimate scope and duration of the event;
•the effectiveness and acceptance of vaccines, other treatments, and their availability in certain regions;
•actions taken by governmental authorities and other third parties in response to the event; and
•the effect that the event may have on the pace of economic growth, inflation and the cost of the labor market.
Increased geopolitical unrest and other events could adversely affect the global economy or specific international, regional and domestic markets, which may cause our revenue and earnings to decline. Global conflicts and tensions continue to pose significant risks to the financial services industry and our operations. State-based armed conflicts have emerged as the top immediate global risk, with geopolitical instability driven by ongoing conflicts such as the Russia-Ukraine war and the Israel-Hamas confrontation in Gaza creating substantial economic uncertainty. The prolonged nature of these conflicts has contributed to increased volatility in commodity and energy prices, disrupted global supply chains, and created significant instability in financial markets. Sanctions and trade tensions have escalated geoeconomic confrontation, potentially exacerbating market instability. While our direct exposure to these conflicts remains limited, the broader economic consequences present complex challenges for our business. The potential for increased cyberattacks, particularly from state-affiliated actors, poses a significant threat to our operational infrastructure. The export of disruption by major global powers like the United States and China is accelerating geoeconomic fragmentation, creating an increasingly unpredictable business environment. Our exposure to these geopolitical risks is particularly pronounced in regions where we currently operate or seek to expand, potentially impacting our revenue, earnings, and strategic growth initiatives. The global economic recovery remains fragile, with the risk of biological, chemical, or nuclear weapons escalating in the geopolitical risk rankings. These multifaceted challenges require continuous monitoring and adaptive strategies to mitigate potential adverse effects on our operations, financial performance, and long-term strategic objectives. As the geopolitical landscape continues to evolve, we must remain vigilant in assessing and responding to emerging risks that could materially impact our business and the broader financial services industry.
Climate change concerns and incidents could disrupt our businesses, adversely affect the profitability of certain of our investments, adversely affect client activity levels, adversely affect the creditworthiness of our counterparties, or damage our reputation. There continues to be increasing concern over the risks of climate change and related environmental sustainability matters. Climate change may cause extreme weather events that disrupt operations at one or more of our or our customer’s or client’s locations, which may negatively affect our ability to service and interact with our clients, and also may adversely affect the value of certain of our investments, including our real estate investments. Climate change, as well as uncertainties related to the transition to a lower carbon dependent economy, may also have a negative impact on the financial condition of our clients, which may decrease revenues from those clients and increase the credit risk associated with loans and other credit exposures to those clients. Additionally, our reputation and client relationships may be damaged as a result of our involvement, or our clients’ involvement, in certain industries or projects associated with causing or exacerbating climate change, as well as any decisions we make to continue to conduct or change our activities in response to considerations relating to climate change.
New regulations or guidance relating to climate change and the transition to a lower carbon dependent economy, as well as the perspectives of legislative bodies, shareholders, employees and other stakeholders regarding climate change, may affect whether and on what terms and conditions we engage in certain activities or offer certain products, as well as impact our business reputation and efforts to recruit and retain employees and customers. The risks associated with, and the perspective of regulators, governments, shareholders, employees and other stakeholders regarding, climate change are continuing to evolve rapidly, which can make it difficult to assess the ultimate impact on us of climate change-related risks and uncertainties.
We are subject to risks relating to environmental, social, and governance (ESG) matters that could adversely affect our reputation, business, financial condition, and results of operations, as well as the price of our stock. We are subject to increasing scrutiny from clients, investors, regulators, elected officials, shareholders and other stakeholders with respect to ESG matters. A lack of harmonization globally in relation to ESG laws and regulations leads
21
to a risk of fragmentation across global jurisdictions. This may create conflicts across our global business, which could impact our competitiveness in the market and damage our reputation resulting in a material adverse effect on our business. For example, the European Securities and Markets Authority (ESMA) introduced stringent guidelines on ESG-related fund names, aiming to eliminate ambiguity in the use of sustainability-related terminology in financial products. As we navigate this complex and global ESG landscape, we recognize that our various stakeholders hold diverse and often conflicting views on ESG topics. Additionally, in the United States, there are numerous state and federal investigation and enforcement actions that are directed at investment managers related to the actual or apparent use of ESG-related investment screens.
The growing interest in ESG factors has increased the risk of accusations of "greenwashing" and potential litigation or regulatory enforcement actions. The lack of global harmonization in ESG laws and regulations has led to fragmentation across jurisdictions, creating conflicts across global businesses and potentially impacting competitiveness and reputation. We may, from time to time, communicate certain initiatives, targets, or goals regarding environmental matters, diversity, responsible sourcing, or other ESG matters. These initiatives, targets, or goals could be difficult and expensive to implement, and we may not be able to accomplish them within the timelines we announce or at all. Our reputation, business, financial performance, and growth could be adversely affected if stakeholders react negatively to the targets or goals that we set, or if our ESG-related data, processes, and reporting are incomplete or inaccurate, or if we fail to achieve progress with respect to ESG targets or goals. The politicization of ESG practices, particularly those related to climate issues, has amplified these risks. We acknowledge that any action or lack thereof with respect to ESG matters may be perceived negatively by at least some stakeholders, potentially damaging our reputation, ability to attract and retain clients and employees, compete effectively, and grow our business.
Item 1B. Unresolved Staff Comments.
None.
Item 1C. Cybersecurity.
We use a risk management framework based on applicable laws and regulations, and informed by industry standards and industry-recognized practices, for managing cybersecurity risks within our products and services, infrastructure, and corporate resources. This risk management framework is implemented through our Cybersecurity Program. Our Cybersecurity Program is designed to provide a framework for assessing the potential threats to the security and integrity of our systems, networks, databases, applications, electronic information and intellectual property and developing appropriate defenses based on these assessments. We routinely invest to develop and implement numerous cybersecurity programs and processes, including risk management and assessment programs, security and event monitoring capabilities, detailed incident response plans, and other advanced detection, prevention and protection capabilities, including practices and tools to monitor and mitigate insider threats. We regularly assess cybersecurity risks to identify and enumerate threats to us and vulnerabilities these threats can exploit to adversely impact our business operations. In some instances, we engage third parties to conduct or assist us with conducting cybersecurity risk assessments. We have developed and implemented a security infrastructure designed to ensure infrastructure and data confidentiality, integrity, and availability.
Key components of our Cybersecurity Program include, but are not limited to, the following:
•Information Security Governance: We designed what we believe are appropriate measures, policies and procedures to ensure that information and information systems are properly protected given the nature of our businesses and the size and complexity of our organization, including our reliance on third parties;
•Organization: The Information Security team, led by the Chief Information Security Officer (CISO) , is responsible for implementing and managing the Cybersecurity Program with executive oversight from the Chief Executive Officer and Chief Financial Officer, as well as oversight from our Board of Directors. Our CISO has extensive cybersecurity knowledge and skills gained from over 26 years of work experience on the information security team at SEI. In addition to the CISO’s cybersecurity experience, he has certifications in risk and information systems control along with information systems auditing
22
•Cybersecurity Controls: We have implemented what we believe are appropriate preventative measures to protect SEI’s infrastructure, systems, and data. These measures include network architecture segmentation, system and platform hardening, in-transit and at-rest encryption, dynamic security awareness training, regular vulnerability scanning and penetration testing, firewalls, web proxy filtering, and multifactor authentication, all of which we constantly evaluate and upgrade as we believe is needed based on our risk assessments;
•Managed Detection and Response: Our security operations center’s uninterrupted monitoring processes utilize tools such as network and host-based intrusion detection systems, endpoint detection and response technology, distributed denial of service detection and mitigation service, and centralized security and information event management (SIEM). These efforts are further supplemented by signals operations and threat hunting that provide the incident responders the ability to write custom detections to complement commercial technology controls and execute triage/analysis, threat intelligence, and response;
•Independent Audits: We are subject to industry regulatory examinations. Our internal audit function provides independent assessment and assurance on the overall operations of our Cybersecurity and Privacy Programs and the supporting control frameworks. We also engage various reputable third parties to perform independent auditing and testing as well as network and web application penetration testing;
•Risk Management Oversight: Enterprise Risk Management, through the Enterprise Risk Committee, provides independent monitoring and reporting of cybersecurity risks commensurate with our Technology Risk Program. In addition, we leverage our Third Party Risk Management, Insider Threats, Business Continuity and Disaster Recovery programs to supplement our Cybersecurity Program ; and
•Privacy Oversight: In addition to our Enterprise Risk Management functions, our Legal and Compliance team maintains a privacy risk management program to assess, manage and report privacy risks related to how we are collecting, using, sharing, and storing user data. Our Privacy team works with our Third Party Risk and Information Security teams to manage privacy-related issues.
Additional information about cybersecurity risks we face is discussed in Item 1A of Part I, “Risk Factors,” under the heading “We are exposed to data and cyber security risks,” which should be read in conjunction with the information above.
Item 2. Properties.
Our corporate headquarters is located in Oaks, Pennsylvania and consists of ten buildings situated on approximately 134 acres. We own and operate the land and buildings, which encompass approximately 628,000 square feet of office space and 34,000 square feet of data center space. We lease other offices which aggregate 182,000 square feet.
Item 3. Legal Proceedings.
We and certain of our subsidiaries are a party to or have property subject to litigation and other proceedings, examinations and investigations that arise in the ordinary course of our business that we do not believe are material. These types of matters could result in fines, penalties, cost reimbursements or contributions, compensatory or treble damages or non-monetary sanctions or relief. We believe the probability is remote that the outcome of any of these matters will have a material adverse effect on SEI as a whole, notwithstanding that the unfavorable resolution of any matter may have a material effect on our net earnings in any particular interim reporting period. We cannot predict the outcome of legal or other proceedings with certainty. These matters include the proceedings summarized in “Note 10. Commitments and Contingencies” included in our Notes to Consolidated Financial Statements.
Item 4. Mine Safety Disclosures.
None.
23
PART II
Item 5. Market for Registrant’s Common Equity, Related Stockholder Matters and Issuer Purchases of Equity Securities.
Price Range of Common Stock and Dividends:
Our common stock is traded on The Nasdaq Global Select Market® (NASDAQ) under the symbol “SEIC.” The following table shows the high and low sales prices for our common stock as reported by NASDAQ and the dividends declared on our common stock for the last two years. Our Board of Directors intends to declare future dividends on a semiannual basis.
| 2024 | High | Low | Dividends | |||||||||||||||||
| First Quarter | $ | 72.54 | $ | 61.58 | $ | — | ||||||||||||||
| Second Quarter | 71.81 | 63.66 | 0.46 | |||||||||||||||||
| Third Quarter | 70.16 | 62.38 | — | |||||||||||||||||
| Fourth Quarter | 87.25 | 68.56 | 0.49 | |||||||||||||||||
| 2023 | High | Low | Dividends | |||||||||||||||||
| First Quarter | $ | 64.69 | $ | 53.93 | $ | — | ||||||||||||||
| Second Quarter | 59.87 | 56.10 | 0.43 | |||||||||||||||||
| Third Quarter | 64.43 | 58.25 | — | |||||||||||||||||
| Fourth Quarter | 64.94 | 52.20 | 0.46 | |||||||||||||||||
According to the records of our transfer agent, there were 194 holders of record of our common stock on December 31, 2024. Because many of such shares are held by brokers and other institutions on behalf of stockholders, we are unable to estimate the total number of stockholders represented by these record holders.
For information on our equity compensation plans, refer to "Note 7. Shareholders' Equity" included in our Notes to Consolidated Financial Statements and Item 12 of this Annual Report on Form 10-K.
24
Stock Performance Graph:
The following graph shows a comparison from December 31, 2019 through December 31, 2024 of the cumulative total return for our common stock, the NASDAQ Market Index and an Industry Index, a blend of indices including 79% NASDAQ US Asset Managers and Custodians and 21% NASDAQ US Software. This information is obtained from sources believed to be reliable; however, we cannot guarantee their accuracy. Returns are based on historical performance and are not indicative of future results.
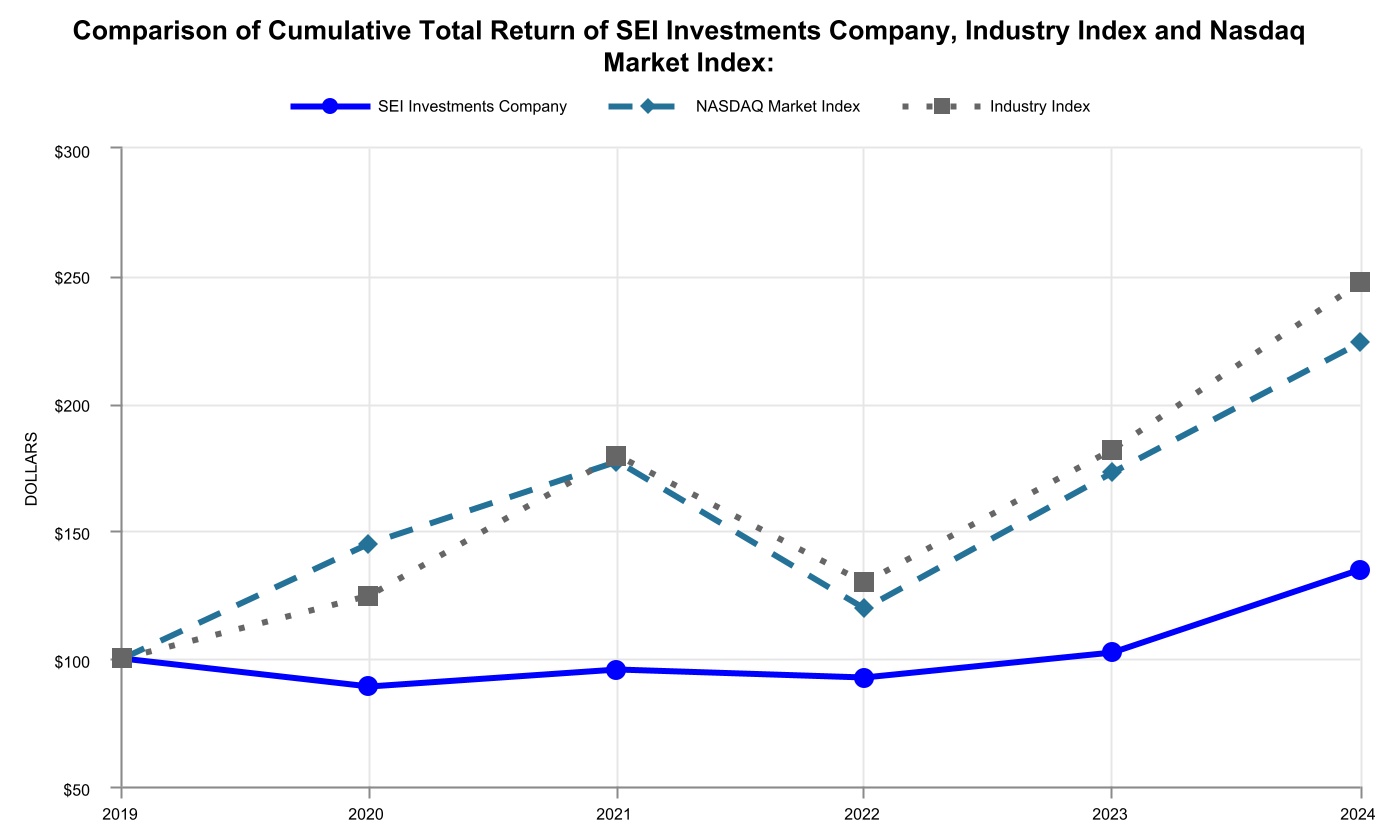
ASSUMES $100 INVESTED ON DECEMBER 31, 2019
ASSUMES DIVIDENDS REINVESTED
FISCAL YEAR ENDED DECEMBER 31,
Issuer Purchases of Equity Securities:
Our Board of Directors has authorized the repurchase of up to $6.228 billion worth of our common stock. Currently, there is no expiration date for our common stock repurchase program (See Note 7 to the Consolidated Financial Statements). On October 22, 2024, our Board of Directors approved an increase in the stock repurchase program by an additional $400.0 million.
Information regarding the repurchase of common stock during the three months ended December 31, 2024 is:
| Period | Total Number of Shares Purchased | Average Price Paid per Share (1) | Total Number of Shares Purchased as Part of Publicly Announced Program |
Approximate Dollar Value of Shares that May Yet Be Purchased Under the Program |
||||||||||||||||||||||
| October 2024 | 175,000 | $ | 75.59 | 175,000 | $ | 415,871,000 | ||||||||||||||||||||
| November 2024 | 572,000 | 79.54 | 572,000 | 370,390,000 | ||||||||||||||||||||||
| December 2024 | 2,364,000 | 84.24 | 2,364,000 | 169,600,000 | ||||||||||||||||||||||
| Total | 3,111,000 | 82.89 | 3,111,000 | |||||||||||||||||||||||
(1) Average price paid per share does not include excise tax on stock repurchases.
Item 6. [Reserved]
25
Item 7. Management’s Discussion and Analysis of Financial Condition and Results of Operations.
(In thousands, except share and per-share data)
This discussion reviews and analyzes the consolidated financial condition at December 31, 2024 and 2023, the consolidated results of operations for the years ended December 31, 2024, 2023 and 2022, and other factors that may affect future financial performance. This discussion should be read in conjunction with the Consolidated Financial Statements and Notes to the Consolidated Financial Statements included in Item 8 of this Annual Report.
Certain information contained in this discussion is or may be considered forward-looking. Forward-looking statements relate to future operations, strategies, financial results, expenditures and other uses of capital or other developments. Forward-looking statements are based upon estimates and assumptions that involve certain judgments, risks and uncertainties, many of which are beyond our control or are subject to change. Although we believe our assumptions are reasonable, they could be inaccurate. Our actual future revenues and income could differ materially from our expected results. Further information about factors that could materially affect our results of operations and financial condition include, but are not limited to, the discussion contained in Item 1A, Risk Factors, in this Annual Report on Form 10-K. We have no obligation to publicly update or revise any forward-looking statements.
Overview
Consolidated Summary
SEI Investments Company is a leading global provider of financial technology, operations, and asset management services within the financial services industry. Investment processing fees are earned as either monthly fees for contracted services or as a percentage of the market value of our clients' assets processed on our platforms. Investment operations and investment management fees are earned as a percentage of assets under management, administration or advised assets. As of December 31, 2024, through our subsidiaries and partnerships in which we have a significant interest, we manage, advise or administer approximately $1.6 trillion in hedge, private equity, mutual fund and pooled or separately managed assets.
Condensed Consolidated Statements of Operations for the years ended 2024, 2023 and 2022 were:
| Year Ended December 31, | 2024 | 2023 | Percent Change* |
2022 | Percent Change |
|||||||||||||||||||||||||||
| Revenues | $ | 2,125,151 | $ | 1,919,793 | 11 | % | $ | 1,991,037 | (4) | % | ||||||||||||||||||||||
| Expenses | 1,573,410 | 1,495,269 | 5 | % | 1,515,284 | (1) | % | |||||||||||||||||||||||||
| Income from operations | 551,741 | 424,524 | 30 | % | 475,753 | (11) | % | |||||||||||||||||||||||||
| Net gain (loss) from investments | 2,790 | 2,757 | 1 | % | (3,078) | NM | ||||||||||||||||||||||||||
| Interest income, net of interest expense | 48,334 | 40,444 | 20 | % | 12,559 | 222 | % | |||||||||||||||||||||||||
| Other income | 8,151 | — | NM | 3,379 | NM | |||||||||||||||||||||||||||
| Equity in earnings of unconsolidated affiliates | 135,741 | 126,930 | 7 | % | 120,667 | 5 | % | |||||||||||||||||||||||||
| Income before income taxes | 746,757 | 594,655 | 26 | % | 609,280 | (2) | % | |||||||||||||||||||||||||
| Income taxes | 165,566 | 132,397 | 25 | % | 133,813 | (1) | % | |||||||||||||||||||||||||
| Net income | 581,191 | 462,258 | 26 | % | 475,467 | (3) | % | |||||||||||||||||||||||||
| Diluted earnings per common share | $ | 4.41 | $ | 3.46 | 27 | % | $ | 3.46 | — | % | ||||||||||||||||||||||
* Variances noted "NM" indicate the percent change is not meaningful.
26
Significant Items Impacting Our Financial Results in 2024
Revenues increased $205.4 million, or 11%, to $2.1 billion in 2024 compared to 2023. Net income increased $118.9 million, or 26%, to $581.2 million and diluted earnings per share increased to $4.41 per share in 2024 compared to $3.46 per share in 2023. We believe the following items were significant to our business results during 2024:
•Revenue from Assets under management, administration, and distribution fees increased in 2024 primarily from higher assets under administration due to cross sales to existing alternative investment clients of the Investment Managers segment as well as new sales within the segment. Average assets under administration increased $132.9 billion, or 15%, to $1.0 trillion during 2024, as compared to $880.3 billion during 2023.
•Revenue from the SEI Integrated Cash Program launched in December 2023 in the Investment Advisors segment was $51.5 million during 2024 as compared to $1.5 million in 2023, an increase of $50.0 million. Revenue from this program is included in Asset management, administration and distribution fees on the accompanying Consolidated Statement of Operations.
•Revenue from Asset management, administration and distribution fees also increased from market appreciation and positive cash flows into separately managed account programs and Strategist programs of the Investment Advisors segment. This was partially offset by negative cash flows from SEI fund programs and fee reductions in separately managed account programs. Revenue growth was also partially offset by client losses in the Institutional Investors segment. Average assets under management in equity and fixed income programs, excluding LSV, increased $10.9 billion, or 6%, to $179.5 billion in 2024 as compared to $168.6 billion during 2023.
•Revenue from Information processing and software servicing fees increased in 2024 primarily from new client conversions and growth from existing SEI Wealth PlatformSM (SWP) clients. A one-time early contractual buyout fee of $10.5 million recorded during the second quarter of 2023 from an investment processing client of the Private Banks segment acquired by an existing client partially offset the increase in revenues.
•Earnings from LSV increased to $135.7 million in 2024 as compared to $126.9 million in 2023 due to market appreciation and higher performance fees. Negative cash flows from existing clients and client losses partially offset the increase in earnings from LSV.
•Operating expenses increased from higher personnel costs due to business growth, primarily in the Investment Managers segment, and the impact of inflation on wages and services. Cost containment measures related to consulting and other vendor costs partially offset the increase in operating expenses in 2024.
•During the fourth quarter of 2024, we recognized additional personnel costs from a one-time increase in our incentive compensation awards to employees as a result of better than expected financial results.
•Stock-based compensation costs related to stock options increased during 2024 primarily from the acceleration of $11.2 million in expense from a change in estimate of the attainment of vesting targets for these awards due to strong earnings growth (See the caption "Stock-Based Compensation" later in this discussion for more information).
•Capitalized software development costs were $24.3 million in 2024, of which $13.7 million was for continued enhancements to SWP. Capitalized software development costs also include $10.6 million of software development costs in 2024 for a new platform for the Investment Managers segment.
•Amortization expense related to SWP was $27.5 million in 2024 as compared to $25.6 million in 2023.
•Interest and dividend income was $48.9 million in 2024 as compared to $41.0 million in 2023. The increase in interest and dividend income was due to an overall increase in interest rates and higher invested cash balances.
•In July 2024, SEI sold a condominium located in New York, New York and recognized a net pre-tax gain of $8.2 million after associated costs and expenses. The gain from the sale is included in Other income on the accompanying Consolidated Statement of Operations (See Note 19 to the Notes to Consolidated Financial Statements).
•In December 2024, SEI acquired LifeYield, LLC (LifeYield), a Boston-based, tax-smart technology firm for a cash consideration of $29.0 million (See Note 15 to the Notes to Consolidated Financial Statements).
•Effective tax rates were 22.2% during 2024 and 22.3% during 2023 (See the caption "Income Taxes" later in this discussion for more information).
•SEI repurchased 6.8 million shares of its common stock at an average price of $74.92 per share for a total cost of $512.5 million and paid $120.3 million in cash dividends to shareholders during 2024.
27
Significant Items Impacting Our Financial Results in 2023
Revenues decreased $71.2 million, or 4%, to $1.9 billion in 2023 compared to 2022. Net income decreased $13.2 million, or 3%, to $462.3 million and diluted earnings per share remained unchanged at $3.46 per share in 2023 compared to 2022. We believe the following items were significant to our business results during 2023:
•Revenue from Information processing and software servicing fees decreased primarily from one-time early termination fees of $88.0 million from a significant client of the Private Banks segment recorded during the first quarter 2022. A one-time early contractual buyout fee of $10.5 million recorded during the second quarter 2023 from an investment processing client of the Private Banks segment acquired by an existing client partially offset the decline in revenues. Revenue from Information processing and software servicing fees was positively impacted by new client conversions and growth from existing SWP clients during 2023.
•Revenue from Assets under management, administration, and distribution fees was favorably impacted by higher assets under administration due to new products and additional services provided to existing alternative investment clients of the Investment Managers segment. Average assets under administration increased $38.4 billion, or 5%, to $880.3 billion during 2023 as compared to $841.9 billion during 2022.
•Revenue from Asset management, administration and distribution fees was unfavorably impacted by lower assets under management in equity and fixed income programs from negative cash flows from SEI fund programs and declining average basis points earned on assets in the Investment Advisors segment and client losses in the Institutional Investors segment. The unfavorable impact was partially offset by market appreciation and positive cash flows into separately managed account programs of the Investment Advisors segment. Average assets under management in equity and fixed income programs, excluding LSV, decreased $6.5 billion, or 4%, to $168.6 billion during 2023 as compared to $175.1 billion during 2022.
•Earnings from LSV increased by $6.3 million, or 5%, in 2023 due to market appreciation and higher performance fees. Negative cash flows from existing clients and client losses partially offset the increase in earnings from LSV.
•The decline in operating expenses was primarily due to total costs of $54.8 million related to the Voluntary Separation Program (VSP) recognized during the third quarter 2022. These one-time costs are primarily included in Compensation, benefits and other personnel costs on the accompanying Consolidated Statement of Operations and are reported in corporate overhead expenses. Decreased non-capitalized consulting costs also contributed to the decline in operating expenses during 2023.
•Operational expenses unrelated to the VSP increased in 2023 due to higher personnel costs from business growth, primarily in the Investment Managers segment, competitive labor markets, and investments in compliance infrastructure to meet new regulatory requirements. The increased personnel costs were primarily related to salary and incentive compensation costs.
•Capitalized software development costs were $34.0 million in 2023, of which $18.2 million was for continued enhancements to SWP. Capitalized software development costs also include $15.8 million of software development costs for a new platform for the Investment Managers segment.
•Management decided to abandon certain functionality within the platform for the Investment Managers segment due to a change in development strategy and wrote off $5.3 million of previously capitalized software development costs during the fourth quarter 2023. The expense associated with the write off is included in Facilities, supplies and other costs on the accompanying Consolidated Statement of Operations.
•Amortization expense related to SWP was $25.6 million in 2023 as compared to $35.6 million in 2022. The decline in amortization expense was due to the amortization period of the initial development costs related to SWP which ended in second-quarter 2022.
•Interest and dividend income was $41.0 million in 2023 as compared to $13.3 million in 2022. The increase in interest and dividend income was primarily due to an increase in market interest rates.
•The effective tax rate during 2023 was 22.3% as compared to 22.0% during 2022. The increase in the effective rate was primarily due to reduced tax benefits related to stock option exercises.
•On November 20, 2023, our wholly-owned operating subsidiary in the United Kingdom closed the acquisition of XPS Pensions (Nexus) Limited, principal employer and scheme funder of the National Pensions Trust. We paid a cash consideration of $43.9 million, net for the acquisition and recorded a contingent consideration of $3.9 million that may be earned by the seller over the two years after the closing, subject to the achievement of certain post-closing performance measurements (See Note 16 to the Notes to Consolidated Financial Statements).
•On December 20, 2023, we acquired Altigo, a cloud-based technology platform that provides inventory, e-subscription, and reporting capabilities for alternative investments, for a cash consideration of $12.5 million (See Note 16 to the Notes to Consolidated Financial Statements).
28
•SEI repurchased 5.2 million shares of its common stock at an average price of $59.34 per share for a total cost of $310.8 million and paid $114.8 million in cash dividends to shareholders during 2023.
Other Significant Items Impacting Our Business
Infrastructure Investments
We believe that a critical component of our long-term success is our ability to continually improve our technology infrastructure. Accordingly, we endeavor to:
•automate selected manual processes in our operational, compliance, risk, control and other functions in order to create internal efficiencies;
•evolve our cyber-security and data privacy systems to combat known and emerging threats and meet and exceed industry and regulatory standards around the world;
•increase the resiliency and reliability of our systems; and
•create more efficient technology solutions to scale our various businesses.
We will continue to invest in improving our technology and operational infrastructure in order to maintain the foundation that we believe enables us to best serve our clients’ needs.
Investment Processing and Software Servicing Fees
Investment processing and software servicing fees in our Private Banks segment primarily include application and business-process-outsourcing services, professional fees and transaction-based services. Application and business-process-outsourcing services revenues are based upon the type and number of investor accounts serviced or as a percentage of the market value of the clients’ asset processed on our platforms. Professional services revenues are earned from contracted, project-oriented services. Transaction-based revenues are primarily earned from fees earned on securities trades executed on behalf of our clients. During the fourth quarter of 2024, approximately 47% of our investment processing and software servicing fees are earned as a percentage of the market value of clients’ asset processed, primarily from SWP and our solution clients.
Investment Management Platforms
Our investment management platforms include investment management programs and back-office investment processing outsourcing services and are generally offered on a bundled basis. Although we believe the breadth of our business solutions offer a competitive advantage, factors such as the underperformance of investment products that we manage relative to our competitors or to benchmarks and client preferences for lower cost investment products offered through an unbundled model have resulted in cash outflows and a loss of management fees primarily impacting the Investment Advisors segment.
Sensitivity of our revenues and earnings to capital market fluctuations
The majority of our revenues are based on the value of assets invested in investment products that we manage or administer which are affected by changes in the capital markets and the portfolio strategy of our clients or their customers. The continuation of favorable capital market returns during 2024 had a positive impact on our asset-based fees thereby contributing to growth in our base revenues. Macroeconomic factors such as the reacceleration of inflationary pressures, higher long term interest rates, continued monetary stimulus measures from central banks, and geopolitical tensions, among others, could have significant influence on capital markets in 2025 and beyond. Any prolonged future downturns in general capital market conditions could have adverse effects on our revenues and earnings derived from assets under management and administration.
SEI Integrated Cash Program
In December 2023, we launched the SEI Integrated Cash program, an enhanced cash sweep program offered through SPTC's custody services utilizing an SEI-sponsored money market mutual fund for investment-related cash allocations and FDIC-insured deposit accounts through a network of independent banks. Under the terms of the program, SPTC will earn interest income based on the portion of its client’s cash balances held in the FDIC-insured accounts. This program generated revenue of $51.5 million for the Investment Advisors segment in 2024. A decline in market interest rates or an increase in alternative cash management options selected by clients could significantly reduce the earnings derived from this program. The assets related to the SEI Integrated Cash program are included in Platform-only assets-deposit program of the Investment Advisors segment on the accompanying Ending Assets Balances and Average Assets Balances schedules.
External factors affecting the fiduciary management market
The utilization of defined benefit plans by employers in the United States, Canada and the United Kingdom has been steadily declining. A number of our clients of the Institutional Investors segment have frozen or curtailed their defined
29
benefit plans resulting in decreased revenues and earnings. The current growth strategies of our Institutional Investors segment include entering new global markets and placing greater emphasis on defined contribution and not-for-profit organizations fiduciary management sales opportunities. These strategies may not be successful in mitigating the impact of lower revenues resulting from defined benefit client losses.
Business Growth
Implementing new clients and making strategic investments that drive future revenue growth involves financial, managerial, and operational challenges. We may incur significant expenses to position our technology and operational infrastructure in connection with onboarding new clients and developing new products and services to enter new or adjacent markets. Our overall profitability would be negatively affected if strategic investments and expenses associated with such growth are not matched or exceeded on a timely basis by the revenues that are derived from such investment or growth.
Business Acquisitions
To enhance our capabilities, scale our competitive presence, or enable strategic growth, we pursue selective acquisitions. During 2024, we acquired LifeYield. During 2023, we acquired the National Pensions Trust and Altigo. If we are not able to successfully integrate our past and future acquisitions, or we do not fully realize the anticipated benefits, synergies or objectives of these transactions, we may incur additional costs such as impairment charges to goodwill or intangible assets recognized from acquisitions that could adversely affect our results of operations or financial condition.
30
Ending Asset Balances
This table presents ending asset balances of our clients, or of our clients’ customers, for which we provide management or administrative services through our subsidiaries and partnerships in which we have a significant interest.
| Ending Asset Balances | ||||||||||||||||||||||||||||||||
| (In millions) | As of December 31, | |||||||||||||||||||||||||||||||
| Percent Change | Percent Change | |||||||||||||||||||||||||||||||
| 2024 | 2023 | 2022 | ||||||||||||||||||||||||||||||
| Investment Managers: | ||||||||||||||||||||||||||||||||
| Collective trust fund programs (A) | $ | 202,384 | $ | 156,376 | 29 | % | $ | 141,285 | 11 | % | ||||||||||||||||||||||
| Liquidity funds | 188 | 114 | 65 | % | 199 | (43) | % | |||||||||||||||||||||||||
| Total assets under management | $ | 202,572 | $ | 156,490 | 29 | % | $ | 141,484 | 11 | % | ||||||||||||||||||||||
| Client assets under administration (E) | 1,032,812 | 920,757 | 12 | % | 794,149 | 16 | % | |||||||||||||||||||||||||
| Total assets | $ | 1,235,384 | $ | 1,077,247 | 15 | % | $ | 935,633 | 15 | % | ||||||||||||||||||||||
| Private Banks: | ||||||||||||||||||||||||||||||||
| Equity and fixed-income programs | $ | 25,523 | $ | 24,496 | 4 | % | $ | 22,377 | 9 | % | ||||||||||||||||||||||
| Collective trust fund programs | 4 | 4 | — | % | 7 | (43) | % | |||||||||||||||||||||||||
| Liquidity funds | 2,688 | 3,916 | (31) | % | 3,201 | 22 | % | |||||||||||||||||||||||||
| Total assets under management | $ | 28,215 | $ | 28,416 | (1) | % | $ | 25,585 | 11 | % | ||||||||||||||||||||||
| Client assets under administration | 8,340 | 7,267 | 15 | % | 4,151 | 75 | % | |||||||||||||||||||||||||
| Total assets | $ | 36,555 | $ | 35,683 | 2 | % | $ | 29,736 | 20 | % | ||||||||||||||||||||||
| Investment Advisors: | ||||||||||||||||||||||||||||||||
| Equity and fixed-income programs | $ | 76,283 | $ | 71,634 | 6 | % | $ | 66,240 | 8 | % | ||||||||||||||||||||||
| Liquidity funds | 3,105 | 4,812 | (35) | % | 5,436 | (11) | % | |||||||||||||||||||||||||
| Total Platform assets under management | $ | 79,388 | $ | 76,446 | 4 | % | $ | 71,676 | 7 | % | ||||||||||||||||||||||
| Platform-only assets | 25,244 | 18,324 | 38 | % | 13,931 | 32 | % | |||||||||||||||||||||||||
| Platform-only assets-deposit program | 2,398 | 843 | 184 | % | — | NM | ||||||||||||||||||||||||||
| Total Platform assets | $ | 107,030 | $ | 95,613 | 12 | % | $ | 85,607 | 12 | % | ||||||||||||||||||||||
| Institutional Investors: | ||||||||||||||||||||||||||||||||
| Equity and fixed-income programs | $ | 75,481 | $ | 77,208 | (2) | % | $ | 73,178 | 6 | % | ||||||||||||||||||||||
| Collective trust fund programs | 1 | 1 | — | % | 5 | (80) | % | |||||||||||||||||||||||||
| Liquidity funds | 1,511 | 1,734 | (13) | % | 1,557 | 11 | % | |||||||||||||||||||||||||
| Total assets under management | $ | 76,993 | $ | 78,943 | (2) | % | $ | 74,740 | 6 | % | ||||||||||||||||||||||
| Client assets under advisement | 5,955 | 6,120 | (3) | % | 4,314 | 42 | % | |||||||||||||||||||||||||
| Total assets | $ | 82,948 | $ | 85,063 | (2) | % | $ | 79,054 | 8 | % | ||||||||||||||||||||||
| Investments in New Businesses: | ||||||||||||||||||||||||||||||||
| Equity and fixed-income programs | $ | 2,747 | $ | 2,174 | 26 | % | $ | 1,912 | 14 | % | ||||||||||||||||||||||
| Liquidity funds | 297 | 209 | 42 | % | 215 | (3) | % | |||||||||||||||||||||||||
| Total assets under management | $ | 3,044 | $ | 2,383 | 28 | % | $ | 2,127 | 12 | % | ||||||||||||||||||||||
| Client assets under advisement | 2,185 | 1,150 | 90 | % | 1,077 | 7 | % | |||||||||||||||||||||||||
| Client assets under administration (E) | 14,791 | 14,807 | — | % | 16,342 | (9) | % | |||||||||||||||||||||||||
| Total assets | $ | 20,020 | $ | 18,340 | 9 | % | $ | 19,546 | (6) | % | ||||||||||||||||||||||
| LSV: | ||||||||||||||||||||||||||||||||
| Equity and fixed-income programs (B) | $ | 86,501 | $ | 89,312 | (3) | % | $ | 83,753 | 7 | % | ||||||||||||||||||||||
31
| Total: | ||||||||||||||||||||||||||||||||
| Equity and fixed-income programs (C) | $ | 266,535 | $ | 264,824 | 1 | % | $ | 247,460 | 7 | % | ||||||||||||||||||||||
| Collective trust fund programs | 202,389 | 156,381 | 29 | % | 141,297 | 11 | % | |||||||||||||||||||||||||
| Liquidity funds | 7,789 | 10,785 | (28) | % | 10,608 | 2 | % | |||||||||||||||||||||||||
| Total assets under management | $ | 476,713 | $ | 431,990 | 10 | % | $ | 399,365 | 8 | % | ||||||||||||||||||||||
| Advised assets | 8,140 | 7,270 | 12 | % | 5,391 | 35 | % | |||||||||||||||||||||||||
| Client assets under administration (D) | 1,055,943 | 942,831 | 12 | % | 814,642 | 16 | % | |||||||||||||||||||||||||
| Platform-only assets | 27,642 | $ | 19,167 | 44 | % | 13,931 | 38 | % | ||||||||||||||||||||||||
| Total assets | $ | 1,568,438 | $ | 1,401,258 | 12 | % | $ | 1,233,329 | 14 | % | ||||||||||||||||||||||
(A) Collective trust fund program assets are included in assets under management since SEI is the trustee. Fees earned on this product are less than fees earned on customized asset management programs.
(B) Equity and fixed-income programs include $1.4 billion of assets managed by LSV in which fees are based solely on performance and are not calculated as an asset-based fee (as of December 31, 2024).
(C) Equity and fixed-income programs include $6.4 billion of assets invested in various asset allocation funds at December 31, 2024.
(D) In addition to the assets presented, SEI also administers an additional $10.3 billion in Funds of Funds assets on which SEI does not earn an administration fee (as of December 31, 2024).
(E) Due to the reorganization of business segments, client assets under administration were reclassified from Investment Managers to Investments in New Businesses (See Note 12 to the Consolidated Financial Statements).
32
Average Asset Balances
This table presents average asset balances of our clients, or of our clients’ customers, for which we provide management or administrative services through our subsidiaries and partnerships in which we have a significant interest.
| Average Asset Balances | ||||||||||||||||||||||||||||||||
| (In millions) | For the Year Ended December 31, | |||||||||||||||||||||||||||||||
| Percent Change | Percent Change | |||||||||||||||||||||||||||||||
| 2024 | 2023 | 2022 | ||||||||||||||||||||||||||||||
| Investment Managers: | ||||||||||||||||||||||||||||||||
| Collective trust fund programs (A) | $ | 187,604 | $ | 148,097 | 27 | % | $ | 125,595 | 18 | % | ||||||||||||||||||||||
| Liquidity funds | 226 | 261 | (13) | % | 311 | (16) | % | |||||||||||||||||||||||||
| Total assets under management | $ | 187,830 | $ | 148,358 | 27 | % | $ | 125,906 | 18 | % | ||||||||||||||||||||||
| Client assets under administration (E) | 990,305 | 859,596 | 15 | % | 821,256 | 5 | % | |||||||||||||||||||||||||
| Total assets | $ | 1,178,135 | $ | 1,007,954 | 17 | % | $ | 947,162 | 6 | % | ||||||||||||||||||||||
| Private Banks: | ||||||||||||||||||||||||||||||||
| Equity and fixed-income programs | $ | 25,336 | $ | 23,638 | 7 | % | $ | 23,326 | 1 | % | ||||||||||||||||||||||
| Collective trust fund programs | 5 | 6 | (17) | % | 7 | (14) | % | |||||||||||||||||||||||||
| Liquidity funds | 3,077 | 3,537 | (13) | % | 3,834 | (8) | % | |||||||||||||||||||||||||
| Total assets under management | $ | 28,418 | $ | 27,181 | 5 | % | $ | 27,167 | — | % | ||||||||||||||||||||||
| Client assets under administration | 8,027 | 4,976 | 61 | % | 4,204 | 18 | % | |||||||||||||||||||||||||
| Total assets | $ | 36,445 | $ | 32,157 | 13 | % | $ | 31,371 | 3 | % | ||||||||||||||||||||||
| Investment Advisors: | ||||||||||||||||||||||||||||||||
| Equity and fixed-income programs | $ | 75,115 | $ | 68,407 | 10 | % | $ | 70,394 | (3) | % | ||||||||||||||||||||||
| Liquidity funds | 4,073 | 4,960 | (18) | % | 5,682 | (13) | % | |||||||||||||||||||||||||
| Total Platform assets under management | $ | 79,188 | $ | 73,367 | 8 | % | $ | 76,076 | (4) | % | ||||||||||||||||||||||
| Platform-only assets | 22,100 | 16,026 | 38 | % | 13,574 | 18 | % | |||||||||||||||||||||||||
| Platform-only assets-deposit program | 1,274 | 70 | NM | — | NM | |||||||||||||||||||||||||||
| Total Platform assets | $ | 102,562 | 89,463 | 15 | % | 89,650 | — | % | ||||||||||||||||||||||||
| Institutional Investors: | ||||||||||||||||||||||||||||||||
| Equity and fixed-income programs | $ | 76,622 | $ | 74,546 | 3 | % | $ | 79,415 | (6) | % | ||||||||||||||||||||||
| Collective trust fund programs | 1 | 4 | (75) | % | 5 | (20) | % | |||||||||||||||||||||||||
| Liquidity funds | 1,976 | 1,636 | 21 | % | 1,939 | (16) | % | |||||||||||||||||||||||||
| Total assets under management | $ | 78,599 | $ | 76,186 | 3 | % | $ | 81,359 | (6) | % | ||||||||||||||||||||||
| Client assets under advisement | 7,231 | 4,479 | 61 | % | 4,330 | 3 | % | |||||||||||||||||||||||||
| Total assets | $ | 85,830 | $ | 80,665 | 6 | % | $ | 85,689 | (6) | % | ||||||||||||||||||||||
| Investments in New Businesses: | ||||||||||||||||||||||||||||||||
| Equity and fixed-income programs | $ | 2,421 | $ | 2,053 | 18 | % | $ | 1,968 | 4 | % | ||||||||||||||||||||||
| Liquidity funds | 375 | 205 | 83 | % | 247 | (17) | % | |||||||||||||||||||||||||
| Total assets under management | $ | 2,796 | $ | 2,258 | 24 | % | $ | 2,215 | 2 | % | ||||||||||||||||||||||
| Client assets under advisement | 1,801 | 1,089 | 65 | % | 1,191 | (9) | % | |||||||||||||||||||||||||
| Client assets under administration (E) | 14,949 | 15,773 | (5) | % | 16,391 | (4) | % | |||||||||||||||||||||||||
| Total assets | $ | 19,546 | $ | 19,120 | 2 | % | $ | 19,797 | (3) | % | ||||||||||||||||||||||
| LSV: | ||||||||||||||||||||||||||||||||
| Equity and fixed-income programs (B) | $ | 90,908 | $ | 85,661 | 6 | % | $ | 87,220 | (2) | % | ||||||||||||||||||||||
33
| Total: | ||||||||||||||||||||||||||||||||
| Equity and fixed-income programs (C) | $ | 270,402 | $ | 254,305 | 6 | % | 262,323 | (3) | % | |||||||||||||||||||||||
| Collective trust fund programs | 187,610 | 148,107 | 27 | % | 125,607 | 18 | % | |||||||||||||||||||||||||
| Liquidity funds | 9,727 | 10,599 | (8) | % | 12,013 | (12) | % | |||||||||||||||||||||||||
| Total assets under management | $ | 467,739 | $ | 413,011 | 13 | % | $ | 399,943 | 3 | % | ||||||||||||||||||||||
| Client assets under advisement | 9,032 | 5,568 | 62 | % | 5,521 | 1 | % | |||||||||||||||||||||||||
| Client assets under administration (D) | 1,013,281 | 880,345 | 15 | % | 841,851 | 5 | % | |||||||||||||||||||||||||
| Platform-only assets | 23,374 | 16,096 | 45 | % | 13,574 | 19 | % | |||||||||||||||||||||||||
| Total assets | $ | 1,513,426 | $ | 1,315,020 | 15 | % | $ | 1,260,889 | 4 | % | ||||||||||||||||||||||
(A) Collective trust fund program average assets are included in assets under management since SEI is the trustee. Fees earned on this product are less than fees earned on customized asset management programs.
(B) Equity and fixed-income programs include assets managed by LSV in which fees are based solely on performance and are not calculated as an asset-based fee. The average value of these assets for the year ended December 31, 2024 was $1.7 billion.
(C) Equity and fixed-income programs include $6.3 billion of average assets invested in various asset allocation funds for the year ended December 31, 2024.
(D) In addition to the assets presented, SEI also administers an additional $8.8 billion of average assets in Funds of Funds assets for the year ended December 31, 2024 on which SEI does not earn an administration fee.
(E) Due to the reorganization of business segments, client assets under administration were reclassified from Investment Managers to Investments in New Businesses (See Note 12 to the Consolidated Financial Statements).
In the preceding tables, assets under management are total assets of our clients or their customers invested in our equity and fixed-income investment programs, collective trust fund programs, and liquidity funds for which we provide asset management services through our subsidiaries and partnerships in which we have a significant interest. Advised assets include assets for which we provide advisory services through a subsidiary to the accounts but do not manage the underlying assets. Assets under administration include total assets of our clients or their customers for which we provide administrative services, including client fund balances for which we provide administration and/or distribution services through our subsidiaries and partnerships in which we have a significant interest. Platform-only assets-deposit program include assets of our clients in the SEI Integrated Cash program for which we provide custody services through our federal thrift subsidiary. The assets presented in the preceding tables do not include assets processed on SWP and are not included in the accompanying Consolidated Balance Sheets because we do not own them.
34
Business Segments
Revenues, Expenses and Operating profit (loss) for our business segments for the year ended 2024 compared to the year ended 2023, and for the year ended 2023 compared to the year ended 2022 were:
| Year Ended December 31, | 2024 | 2023 | Percent Change |
2022 | Percent Change |
|||||||||||||||||||||||||||
| Investment Managers: | ||||||||||||||||||||||||||||||||
| Revenues | $ | 728,390 | $ | 645,254 | 13 | % | $ | 599,661 | 8 | % | ||||||||||||||||||||||
| Expenses | 453,085 | 419,196 | 8 | % | 381,965 | 10 | % | |||||||||||||||||||||||||
| Operating profit | $ | 275,305 | $ | 226,058 | 22 | % | $ | 217,696 | 4 | % | ||||||||||||||||||||||
| Operating margin | 38 | % | 35 | % | 36 | % | ||||||||||||||||||||||||||
| Private Banks: | ||||||||||||||||||||||||||||||||
| Revenues | 541,414 | 496,317 | 9 | % | 570,010 | (13) | % | |||||||||||||||||||||||||
| Expenses | 460,375 | 448,490 | 3 | % | 467,821 | (4) | % | |||||||||||||||||||||||||
| Operating profit | $ | 81,039 | $ | 47,827 | 69 | % | $ | 102,189 | (53) | % | ||||||||||||||||||||||
| Operating margin | 15 | % | 10 | % | 18 | % | ||||||||||||||||||||||||||
| Investment Advisors: | ||||||||||||||||||||||||||||||||
| Revenues | 509,408 | 436,298 | 17 | % | 447,766 | (3) | % | |||||||||||||||||||||||||
| Expenses | 282,902 | 259,142 | 9 | % | 251,650 | 3 | % | |||||||||||||||||||||||||
| Operating profit | $ | 226,506 | $ | 177,156 | 28 | % | $ | 196,116 | (10) | % | ||||||||||||||||||||||
| Operating margin | 44 | % | 41 | % | 44 | % | ||||||||||||||||||||||||||
| Institutional Investors: | ||||||||||||||||||||||||||||||||
| Revenues | 285,723 | 289,708 | (1) | % | 323,353 | (10) | % | |||||||||||||||||||||||||
| Expenses | 154,701 | 165,455 | (6) | % | 172,252 | (4) | % | |||||||||||||||||||||||||
| Operating profit | $ | 131,022 | $ | 124,253 | 5 | % | $ | 151,101 | (18) | % | ||||||||||||||||||||||
| Operating margin | 46 | % | 43 | % | 47 | % | ||||||||||||||||||||||||||
| Investments in New Businesses: | ||||||||||||||||||||||||||||||||
| Revenues | 60,216 | 52,216 | 15 | % | 50,247 | 4 | % | |||||||||||||||||||||||||
| Expenses | 74,699 | 70,745 | 6 | % | 73,432 | (4) | % | |||||||||||||||||||||||||
| Operating loss | $ | (14,483) | $ | (18,529) | (22) | % | $ | (23,185) | (20) | % | ||||||||||||||||||||||
For additional information pertaining to our business segments, see Note 12 to the Consolidated Financial Statements.
35
Investment Managers
Revenues increased $83.1 million, or 13%, in 2024 compared to the prior year. Revenues during 2024 were primarily affected by:
•Increased revenues from additional services provided to our largest alternative fund clients; and
•Positive cash flows into alternative and traditional funds from new and existing clients; partially offset by
•Client losses and fund closures.
Revenues increased $45.6 million, or 8%, in 2023 compared to the prior year. Revenues during 2023 were primarily affected by:
•Increased revenues from new products launched and additional services provided to our largest alternative fund clients; and
•Positive cash flows into alternative and traditional funds from new and existing clients; partially offset by
•Client losses and fund closures.
Operating margins were 38% in 2024 and 35% in 2023. Operating income increased $49.2 million, or 22%, in 2024 compared to the prior year. Operating income during 2024 was primarily affected by:
•An increase in revenues as mentioned above; and
•Decreased non-capitalized investment spending, mainly consulting costs; partially offset by
•Increased costs associated with new business, primarily personnel expenses and third-party vendor costs;
•Costs to enhance, support and maintain technologies and investment service capabilities; and
•Increased incentive compensation and stock-based compensation costs related to the attainment of strong financial results during 2024.
Operating margins were 35% in 2023 and 36% in 2022. Operating income increased $8.4 million, or 4%, in 2023 compared to the prior year. Operating income during 2023 was primarily affected by:
•An increase in revenues; and
•Decreased non-capitalized investment spending, mainly consulting costs; partially offset by
•Increased costs associated with new business, primarily personnel expenses and third-party vendor costs;
•Increased personnel costs due to competitive labor markets; and
•The write off of $5.3 million in previously capitalized software development costs.
Private Banks
| Year Ended December 31, | 2024 | 2023 | Percent Change |
2022 | Percent Change |
|||||||||||||||||||||||||||
| Revenues: | ||||||||||||||||||||||||||||||||
Investment processing and software servicing fees |
$ | 401,267 | $ | 363,730 | 10 | % | $ | 447,916 | (19) | % | ||||||||||||||||||||||
Asset management, administration & distribution fees |
140,147 | 132,587 | 6 | % | 122,094 | 9 | % | |||||||||||||||||||||||||
| Total revenues | $ | 541,414 | $ | 496,317 | 9 | % | $ | 570,010 | (13) | % | ||||||||||||||||||||||
Revenues increased $45.1 million, or 9%, in 2024 compared to the prior year. Revenues during 2024 were primarily affected by:
•Increased investment processing fees from new SWP client conversions and growth from existing SWP clients due to market appreciation and increased transaction volumes;
•Increased investment management fees from existing international clients due to market appreciation; and
•Increased investment processing fees earned on our mutual fund trading solution; partially offset by
•One-time early termination fees of $10.5 million from an investment processing client during the second quarter 2023; and
•Lower investment processing fees from the recontracting of existing clients and a client loss.
Revenues decreased $73.7 million, or 13%, in 2023 compared to the prior year. Revenues during 2023 were primarily affected by:
•One-time early termination fees of $88.0 million from a significant investment processing client recorded during the first quarter 2022;
•A negative adjustment to fees from an investment processing client which reduced their business processed with us through divestment;
36
•Reduced investment processing fees earned on our mutual fund trading solution; and
•Lower investment processing fees from the recontacting of existing clients; partially offset by
•Increased investment processing fees from new client conversions;
•One-time early termination fees of $10.5 million from an investment processing client acquired by an existing client recorded in second quarter 2023;
•Increased revenues from U.K. clients on cash balances due to increased interest rates, and
•Increased investment management fees from market appreciation.
Operating margins were 15% in 2024 and 10% in 2023. Operating income increased $33.2 million, or 69%, in 2024 compared to the prior year. Operating income in 2024 was primarily affected by:
•An increase in revenues as mentioned above; and
•Decreased costs, mainly non-capitalized consulting and other vendor costs from cost containment measures; partially offset by
•Increased amortization expense related to SWP;
•Increased personnel costs from business growth; and
•Increased incentive compensation and stock-based compensation costs related to the attainment of strong financial results during 2024.
Operating margins were 10% in 2023 and 18% in 2022. Operating income decreased $54.4 million, or 53%, in 2023 compared to the prior year. Operating income in 2023 was primarily affected by:
•A decrease in revenues;
•Increased personnel costs due to competitive labor markets; and
•Increased costs, mainly personnel costs, primarily related to maintenance, support and client migrations to SWP; partially offset by
•Decreased non-capitalized consulting costs;
•Decreased amortization expense related to SWP; and
•Decreased amortization expense related to deferred sales commissions.
Investment Advisors
| Year Ended December 31, | 2024 | 2023 | Percent Change |
2022 | Percent Change |
|||||||||||||||||||||||||||
| Revenues: | ||||||||||||||||||||||||||||||||
| Investment management fees-SEI fund programs | $ | 233,992 | $ | 239,244 | (2) | % | $ | 263,266 | (9) | % | ||||||||||||||||||||||
| Separately managed account fees | 197,638 | 174,418 | 13 | % | 162,762 | 7 | % | |||||||||||||||||||||||||
| Other fees | 77,778 | 22,636 | 244 | % | 21,738 | 4 | % | |||||||||||||||||||||||||
| Total revenues | $ | 509,408 | $ | 436,298 | 17 | % | $ | 447,766 | (3) | % | ||||||||||||||||||||||
Revenues increased $73.1 million, or 17%, in 2024 compared to the prior year. Revenues during 2024 were primarily affected by:
•Increased fee revenue of $50.0 million from the SEI Integrated Cash Program; and
•Increased fees from separately managed account programs and Strategist programs due to growth from new and existing clients and market appreciation; partially offset by
•Decreased investment management fees from SEI fund programs resulting from the continued shift out of SEI fund programs into separately managed accounts and other investment products; and
•Fee reductions in our separately managed account programs.
Revenues decreased $11.5 million, or 3%, in 2023 compared to the prior year. Revenues during 2023 were primarily affected by:
•Decreased investment management fees from SEI fund programs resulting from negative cash flows and a decrease in average basis points earned on assets; partially offset by
•Increased fees from separately managed account programs from positive cash flows; and
•The positive impact from market appreciation on our asset-based fees.
37
Operating margins were 44% in 2024 and 41% in 2023. Operating income increased $49.4 million, or 28%, in 2024 compared to the prior year. Operating income in 2024 was primarily affected by:
•An increase in revenues as mentioned above; and
•Decreased non-capitalized consulting costs; partially offset by
•Increased direct expenses associated with the increase in separately managed account fees;
•Increased personnel costs from business growth; and
•Increased incentive compensation and stock-based compensation costs related to the attainment of strong financial results during 2024.
Operating margins were 41% in 2023 and 44% in 2022. Operating income decreased $19.0 million, or 10%, in 2023 compared to the prior year. Operating income in 2023 was primarily affected by:
•A decrease in revenues;
•Increased personnel costs;
•Increased net direct expenses primarily associated with the increase in separately managed account fees; and
•Increased non-capitalized consulting costs; partially offset by;
•Decreased amortization expense related to SWP.
Institutional Investors
Revenues decreased $4.0 million, or 1%, in 2024 compared to the prior year. Revenues during 2024 were primarily affected by:
•Decreased investment management fees from client losses; partially offset by
•Increased investment management fees from existing clients due to higher assets under management due to market appreciation;
•Revenues from new Outsourced Chief Investment Officer (OCIO) platform clients; and
•Added revenues from the acquisition of XPS Pensions (Nexus) Limited.
Revenues decreased $33.6 million, or 10%, in 2023 compared to the prior year. Revenues during 2023 were primarily affected by:
•Decreased investment management fees from defined benefit client losses; partially offset by
•Revenues from new Outsourced Chief Investment Officer (OCIO) platform clients; and
•The positive impact from market appreciation on our asset-based fees.
Operating margins were 46% in 2024 and 43% in 2023. Operating income increased $6.8 million, or 5%, in 2024 compared to the prior year. Operating income during 2024 was primarily affected by:
•Decreased direct expenses associated with investment management fees;
•Decreased costs, primarily personnel, related to cost containment measures; and
•A one-time operational charge of $4.5 million related to a client reimbursement during the second quarter 2023; partially offset by
•A decrease in revenues as mentioned above;
•Increased costs and amortization related to the acquisition of XPS Pensions (Nexus) Limited; and
•Increased stock-based compensation costs related to the attainment of strong financial results during 2024.
Operating margins were 43% in 2023 and 47% in 2022. Operating income decreased $26.8 million, or 18%, in 2023 compared to the prior year. Operating income during 2023 was primarily affected by:
•A decrease in revenues;
•A one-time operational charge of $4.5 million related to a client reimbursement; partially offset by
•Decreased direct expenses associated with investment management fees; and
•Decreased professional fees.
38
Investments in New Businesses
| 2024 | 2023 | Percent Change |
2022 | Percent Change |
|||||||||||||||||||||||||
| Revenues: | |||||||||||||||||||||||||||||
| SEI Family Office Services | $ | 34,641 | $ | 32,234 | 7% | $ | 30,873 | 4 | % | ||||||||||||||||||||
| SEI Private Wealth Management | 20,501 | 18,244 | 12% | 17,907 | 2 | % | |||||||||||||||||||||||
| Other | 5,074 | 1,738 | 192% | 1,467 | 18 | % | |||||||||||||||||||||||
| Total revenues | $ | 60,216 | $ | 52,216 | 15% | $ | 50,247 | 4 | % | ||||||||||||||||||||
Revenues increased $8.0 million, or 15%, in 2024 compared to the prior year. Revenues during 2024 were primarily affected by:
•Increased revenues from hosted technology offerings through SEI Family Office Services due to increased non-recurring implementation fees and new business; and
•Increased revenues from SEI Private Wealth Management through higher assets under advisement due to market appreciation and new business.
Revenues increased $2.0 million, or 4%, in 2023 compared to the prior year. Revenues during 2023 were primarily affected by:
•Increased revenues from hosted technology offerings through SEI Family Office Services due new business; partially offset by
•Decreased non-recurring implementation fees for hosted technology offerings through SEI Family Office Services.
Other
Corporate overhead expenses
Corporate overhead expenses primarily consist of general and administrative expenses and other costs not directly attributable to a reportable business segment. Corporate overhead expenses were $147.6 million, $132.2 million and $168.2 million in 2024, 2023 and 2022, respectively. The increase in corporate overhead expenses during 2024 was primarily due to incentive compensation, severance costs, stock-based compensation costs and investments in upgrading and enhancing various technologies utilized by corporate overhead units. Additionally, personnel costs increased from enhancements to further build our compliance infrastructure. The decrease in corporate overhead expenses during 2023 was primarily due to personnel costs associated with the VSP recorded in the third quarter of 2022 (See Note 14 to the Consolidated Financial Statements). Non-recurring consulting costs related to corporate strategic planning, target market review and other corporate analysis projects partially offset the decrease in corporate overhead expenses in 2023.
Other income and expense items
Other income and expense items on the accompanying Consolidated Statements of Operations consist of:
| Year Ended December 31, | 2024 | 2023 | 2022 | |||||||||||||||||
| Equity in earnings of unconsolidated affiliates | $ | 135,741 | $ | 126,930 | $ | 120,667 | ||||||||||||||
| Interest and dividend income | 48,897 | 41,027 | 13,308 | |||||||||||||||||
| Net gain (loss) from investments | 2,790 | 2,757 | (3,078) | |||||||||||||||||
| Interest expense | (563) | (583) | (749) | |||||||||||||||||
| Other income | 8,151 | — | 3,379 | |||||||||||||||||
| Total other income and expense items, net | $ | 195,016 | $ | 170,131 | $ | 133,527 | ||||||||||||||
Equity in earnings of unconsolidated affiliates
Equity in earnings of unconsolidated affiliate reflects our 38.6% ownership interest in LSV. The table below presents the revenues and net income of LSV and our proportionate share in LSV's earnings.
| 2024 | 2023 | Percent Change | 2022 | Percent Change | ||||||||||||||||||||||||||||
| Revenues | $ | 457,589 | $ | 426,270 | 7 | % | $ | 406,895 | 5 | % | ||||||||||||||||||||||
| Net income | 351,815 | 328,905 | 7 | % | 312,180 | 5 | % | |||||||||||||||||||||||||
| SEI's proportionate share in the earnings of LSV | $ | 135,741 | $ | 126,930 | 7 | % | $ | 120,667 | 5 | % | ||||||||||||||||||||||
39
The increase in earnings from LSV in 2024 and 2023 was primarily due to higher assets under management from market appreciation and higher performance fees. Negative cash flows from existing clients and client losses partially offset the increase in earnings from LSV. Average assets under management by LSV increased $5.2 billion to $90.9 billion during 2024 as compared to $85.7 billion during 2023, an increase of 6%.
Interest and dividend income
Interest and dividend income is earned based upon the amount of cash that is invested daily. The increase in interest and dividend income in 2024 was due to rising market interest rates during 2023 and higher invested cash balances. The increase in 2023 was due to increased market interest rates.
Net gain (loss) from investments
Net gains and losses from investments during 2024 and 2023 were primarily due to realized and unrealized gains and losses recorded in current earnings related to the investment funds sponsored by LSV, equity holdings and SEI-sponsored investment products (See Note 5 to the Consolidated Financial Statements).
Other income
Other income during 2024 is related to a net gain of $8.2 million recognized from the sale of property located in New York, New York (See Note 19 to the Consolidated Financial Statements).
Amortization
Amortization expense on the accompanying Consolidated Statements of Operations consists of:
| 2024 | 2023 | Percent Change | 2022 | Percent Change | |||||||||||||||||||||||||
| Capitalized software development costs | $ | 28,100 | $ | 26,227 | 7% | $ | 41,437 | (37)% | |||||||||||||||||||||
| Intangible assets | 13,448 | 12,161 | 11% | 12,580 | (3)% | ||||||||||||||||||||||||
| Other | 321 | 281 | 14% | 263 | 7% | ||||||||||||||||||||||||
| Total amortization expense | $ | 41,869 | $ | 38,669 | 8% | $ | 54,280 | (29)% | |||||||||||||||||||||
Capitalized software development costs
The increase in amortization expense related to capitalized software development costs during 2024 was primarily due to significant enhancements to SWP placed into service during 2024. The decline in amortization expense in 2023 was due to the amortization period associated with the initial development work related to SWP which began in mid-2007 when the platform was determined to be ready for its intended use. The amortization expense related to these initial software development costs ended in the second quarter of 2022 (See Note 1 to the Consolidated Financial Statements). We expect to recognize amortization expense of $28.6 million related to all capitalized software development costs in 2025.
Intangible assets
The increase in amortization expense related to intangible assets and asset purchases in 2024 was due to the acquisitions of XPS Pensions (Nexus) Limited and Altigo during the fourth quarter 2023 (See Note 15 to the Consolidated Financial Statements). Through these transactions, we acquired intangible assets related to technology, trade names and client relationships which are amortized over the estimated useful life of the assets. We expect to recognize amortization expense of $13.5 million related to all intangible assets in 2025.
Income Taxes
Our effective tax rate was 22.2% for 2024, 22.3% for 2023 and 22.0% for 2022. The effective tax rate is affected by recurring items, such as the U.S. federal tax rates and tax rates in various states and foreign jurisdictions and the relative amount of income earned in those jurisdictions. The income earned by jurisdiction has been fairly consistent. The effective tax rate is also affected by discrete items that may occur in any given year, but are not consistent from year to year.
40
Below are the most significant recurring and discrete items (See Note 11 to the Consolidated Financial Statements for more information):
| Year Ended December 31, | 2024 | 2023 | 2022 | ||||||||||||||
| Statutory rate | 21.0 | % | 21.0 | % | 21.0 | % | |||||||||||
| State taxes, net of federal tax benefit | 2.1 | 2.6 | 2.9 | ||||||||||||||
| Foreign tax expense and tax rate differential | 0.2 | (0.3) | (0.2) | ||||||||||||||
| Tax benefit from stock option exercises | (0.7) | (0.3) | (0.7) | ||||||||||||||
| Research and development tax credit | (0.9) | (1.1) | (1.1) | ||||||||||||||
| Foreign-Derived Intangible Income Deduction (FDII) |
(0.2) | (0.3) | (0.3) | ||||||||||||||
| Other, net | 0.7 | 0.7 | 0.4 | ||||||||||||||
| 22.2 | % | 22.3 | % | 22.0 | % | ||||||||||||
The decrease in the effective rate in 2024 was primarily due to the recognition of tax credits and a reduction of the valuation reserve for net operating losses impacting our state tax rate. Increased tax benefits related to stock option exercises as compared to the prior year also reduced our effective rate. The increased corporate tax rate in the United Kingdom partially offset the decline in the effective tax rate in 2024.
The Organization for Economic Co-operation and Development (OECD) has a framework to implement a global minimum corporate tax of 15% for companies with global revenues and profits above certain thresholds (referred to as Pillar Two). Certain aspects of Pillar Two became effective January 1, 2024 and other aspects are effective January 1, 2025. While it is uncertain whether the U.S. will enact legislation to adopt Pillar Two, certain countries in which we operate have adopted legislation, and other countries are in the process of introducing legislation to implement Pillar Two. We have determined Pillar Two has not had a material impact on our effective tax rate, consolidated results of operation, financial position, or cash flows.
Stock-Based Compensation
During 2024, 2023 and 2022, we recognized approximately $58.6 million, $31.3 million and $39.4 million, respectively, in stock-based compensation expense. Our stock-based compensation expense in 2024 primarily consisted of $41.2 million related to stock options and $16.7 million related to restricted stock units (RSUs). The amount of stock-based compensation expense related to stock options is recognized based upon an estimate of when the financial vesting targets may be achieved. Any change in estimate could result in the remaining amount of stock-based compensation expense to be accelerated, spread out over a longer period, or reversed. This may cause volatility in the recognition of stock-based compensation expense and materially affect earnings (See Note 7 to the Consolidated Financial Statements for more information).
During 2024, 2023 and 2022, we revised the estimates of when certain vesting targets for stock options were expected to be achieved. These changes in estimates resulted in an increase in stock-based compensation expense of $11.2 million in 2024, and a decrease of $6.9 million and $4.9 million in 2023 and 2022, respectively.
There was approximately $67.9 million of unrecognized compensation cost related to unvested employee stock options at December 31, 2024 and we expect to recognize approximately $31.1 million in stock-based compensation costs for stock options in 2025.
There was approximately $52.7 million of unrecognized compensation cost related to RSUs at December 31, 2024 and we expect to recognize approximately $25.6 million in stock-based compensation costs for RSUs in 2025.
Fair Value Measurements
The fair value of financial assets and liabilities, except for the investment funds sponsored by LSV, is determined in accordance with the fair value hierarchy. The fair value of the investment funds sponsored by LSV is measured using the net asset value per share (NAV) as a practical expedient. The fair value of all other financial assets are determined using Level 1 or Level 2 inputs and consist mainly of investments in equity or fixed-income investment products that are quoted daily and Government National Mortgage Association (GNMA) and other U.S. government agency securities that are single issuer pools that are valued based on current market data of similar assets. Level 3 financial liabilities at December 31, 2024 and December 31, 2023 consist of contingent considerations resulting from business acquisitions (See Note 15 to the Consolidated Financial Statements).
41
Regulatory Matters
Like many firms operating within the financial services industry, we are experiencing a complex and changing regulatory environment across our markets. Our current scale and reach as a provider to the financial services industry, the introduction and implementation of new solutions for our financial services industry clients, the increased regulatory oversight of the financial services industry generally, new laws and regulations affecting the financial services industry and ever-changing regulatory interpretations of existing laws and regulations, and a greater propensity of regulators to pursue enforcement actions and other sanctions against regulated entities, have made this an increasingly challenging and costly regulatory environment in which to operate.
SEI and some of our regulated subsidiaries have undergone or been scheduled to undergo a range of periodic or thematic reviews, examinations or investigations by numerous regulatory authorities around the world, including the Office of the Comptroller of the Currency, the Securities and Exchange Commission, the Financial Industry Regulatory Authority, the Financial Conduct Authority of the United Kingdom (FCA), the Central Bank of Ireland (CBI), the Commission de Surveillance du Secteur Financier (CSSF) of the Grand Duchy of Luxembourg, and others. These regulatory activities typically result in the identification of matters or practices to be addressed by us or our subsidiaries and, in certain circumstances, the regulatory authorities require remediation activities or pursue enforcement proceedings against us or our subsidiaries. As described under the caption “Regulatory Considerations” in Item 1 of this report, the range of possible sanctions that are available to regulatory authorities include limitations on our ability to engage in business for specified periods of time or with certain restrictions, the revocation of registration, censures and fines. The direct and indirect costs of responding to these regulatory activities and of complying with new or modified regulations, as well as the potential financial costs and potential reputational impact against us of any enforcement proceedings that might result, is uncertain but could have a material adverse impact on our operating results or financial position.
Liquidity and Capital Resources
| Year Ended December 31, | 2024 | 2023 | 2022 | |||||||||||||||||
| Net cash provided by operating activities | $ | 622,343 | $ | 447,030 | $ | 566,119 | ||||||||||||||
| Net cash used in investing activities | (117,302) | (141,543) | (89,809) | |||||||||||||||||
| Net cash used in financing activities | (494,401) | (331,324) | (437,235) | |||||||||||||||||
| Effect of exchange rate changes on cash and cash equivalents | (5,445) | 7,476 | (17,474) | |||||||||||||||||
| Net increase (decrease) in cash and cash equivalents | 5,195 | (18,361) | 21,601 | |||||||||||||||||
| Cash, cash equivalents and restricted cash, beginning of year | 834,998 | 853,359 | 831,758 | |||||||||||||||||
| Cash, cash equivalents and restricted cash, end of year | $ | 840,193 | $ | 834,998 | $ | 853,359 | ||||||||||||||
Our credit facility provides for borrowings up to $325.0 million and is scheduled to expire in April 2026. As of January 31, 2025, we had outstanding letters of credit of $4.9 million which reduced the amount available under the credit facility. These letters of credit were primarily issued for the expansion of the corporate headquarters and are due to expire in 2025. As of January 31, 2025, the amount of the credit facility available for corporate purposes was $320.1 million.
The availability of the credit facility is subject to compliance with certain covenants set forth in the agreement. The credit facility contains covenants which restrict our ability to engage in transactions with affiliates other than wholly-owned subsidiaries or to incur liens or certain types of indebtedness as defined in the agreement. In the event of a default under the credit facility, we would also be restricted from paying dividends on, or repurchasing, our common stock. Currently, our ability to borrow from the credit facility is not limited by any covenant of the agreement (See Note 6 to the Consolidated Financial Statements).
The majority of excess cash reserves are primarily placed in accounts located in the United States that invest in SEI-sponsored money market mutual funds denominated in the U.S. dollar. We also utilize demand deposit accounts or money market accounts at several well-established financial institutions located in the United States. Accounts used to manage these excess cash reserves do not impose any restrictions or limitations that would prevent us from being able to access such cash amounts immediately. As of January 31, 2025, the amount of cash and cash equivalents considered free and immediately accessible for other general corporate purposes was $276.3 million.
Cash and cash equivalents include accounts managed by our subsidiaries that are used in their operations or to cover specific business and regulatory requirements. The availability of this cash for other purposes beyond the operations of these subsidiaries may be limited. We therefore do not include accounts of our foreign subsidiaries in the calculation of free and immediately accessible cash for other general corporate purposes. A portion of the undistributed earnings of foreign subsidiaries are deemed repatriated. Any subsequent transfer of available cash related to the repatriated earnings of foreign subsidiaries could significantly increase free and immediately accessible cash.
42
Cash flows from operations increased $175.3 million in 2024 compared to 2023 primarily from the increase in net income, the increase in accrued liabilities primarily due to higher personnel compensation costs, increased partnership distributions from our unconsolidated affiliate, LSV, and non-cash items. The increase in cash flows from operations was partially offset by higher receivables from clients of the Investment Managers segment. Cash flows from operations decreased $119.1 million in 2023 compared to 2022 primarily from the decrease in net income, an increase in receivables from clients of the Investment Managers segment, and a decrease in accrued liabilities primarily from payments related to the VSP.
Net cash used in investing activities includes:
•Purchases, sales and maturities of marketable securities. Our purchases, sales and maturities of marketable securities during 2024, 2023 and 2022 were as follows:
| 2024 | 2023 | 2022 | ||||||||||||||||||
| Purchases | $ | (177,025) | $ | (143,389) | $ | (178,217) | ||||||||||||||
| Sales and maturities | 152,917 | 121,988 | 161,160 | |||||||||||||||||
| Net investing activities from marketable securities | $ | (24,108) | $ | (21,401) | $ | (17,057) | ||||||||||||||
See Note 5 to the Consolidated Financial Statements for more information related to marketable securities.
•The capitalization of costs incurred in developing computer software. We capitalized $24.3 million, $34.0 million and $35.3 million of software development costs in 2024, 2023 and 2022, respectively. Our software development costs are related to significant enhancements for the expanded functionality of the SEI Wealth Platform and the development of a new platform for the Investment Managers segment (See Note 1 to the Consolidated Financial Statements).
•Capital expenditures. Capital expenditures in 2024, 2023 and 2022 primarily include capital outlays for purchased software and equipment for data center operations. We continue to evaluate improvements to our information technology infrastructure which, if implemented, will result in additional expenditures for purchased software and equipment for data center operations.
•Cash paid for acquisitions, net of cash acquired. In 2024, we made a net cash payment of $29.0 million for the acquisition of LifeYield. In 2023, we made net cash payments of $43.9 million and $12.5 million for the acquisitions of XPS Pensions (Nexus) Limited and Altigo, respectively (See Note 15 to the Consolidated Financial Statements).
•Proceeds from fixed asset dispositions. In 2024, we received proceeds of $8.8 million after associated costs and expenses from the sale of property located in New York, New York.
Net cash used in financing activities includes:
•The repurchase of our common stock. The Board of Directors has authorized the repurchase of common stock through multiple authorizations. Currently, there is no expiration date for the common stock repurchase program. The following table lists information regarding repurchases of common stock during 2024, 2023 and 2022:
| Year | Total Number of Shares Repurchased |
Average Price Paid per Share |
Total Cost | |||||||||||||||||
| 2024 | 6,840,000 | $ | 74.92 | $ | 512,477 | |||||||||||||||
| 2023 | 5,237,000 | 59.34 | 310,769 | |||||||||||||||||
| 2022 | 5,914,000 | 57.22 | 338,442 | |||||||||||||||||
•Proceeds from the issuance of our common stock. We received $126.0 million, $101.2 million and $58.2 million in proceeds from the issuance of common stock during 2024, 2023 and 2022, respectively. The proceeds we receive from the issuance of common stock is directly attributable to the levels of stock option exercise activity.
•Dividend payments. Cash dividends paid during 2024, 2023 and 2022 were as follows:
| Year | Cash Dividends Paid | Cash Dividends Paid per Share |
||||||||||||
| 2024 | $ | 120,346 | $ | 0.92 | ||||||||||
| 2023 | 114,837 | 0.86 | ||||||||||||
| 2022 | 109,830 | 0.80 | ||||||||||||
The Board of Directors declared a semi-annual cash dividend of $0.49 per share on December 12, 2024. The dividend was paid on January 8, 2025 for a total of $63.9 million.
43
Cash Requirements
Cash requirements and liquidity needs are primarily funded through cash flow from operations and our capacity for additional borrowing. At December 31, 2024, unused sources of liquidity consisted of cash and cash equivalents and the amount available under our credit facility.
We are obligated to make payments in connection with the credit facility, operating leases, maintenance contracts and other commitments (See Notes 6, 10 and 18 to the Consolidated Financial Statements). We believe our operating cash flow, available borrowing capacity, and existing cash and cash equivalents will provide adequate funds for these obligations and ongoing operations. We currently anticipate that our available funds and cash flow from operations will be sufficient to meet our operational cash needs and fund our stock repurchase program for at least the next 12 months and for the foreseeable future.
Critical Accounting Policies and Estimates
The accompanying consolidated financial statements and supplementary information were prepared in accordance with accounting principles generally accepted in the United States. Inherent in the application of many of these accounting policies is the need for management to make estimates which require extensive judgments in the determination of certain revenues, expenses, assets and liabilities. Materially different financial results can occur as circumstances change and additional information becomes known. We believe that the assumptions and estimates associated with computer software development costs, income taxes, stock-based compensation and the valuation of long-lived assets including goodwill and intangible assets acquired in an acquisition, when applicable, have the greatest potential to have a material impact on our consolidated financial statements. Therefore, we consider these to be our critical accounting policies and estimates. All of our significant accounting policies are discussed in Note 1 to the Consolidated Financial Statements.
Computer Software Development Costs:
We utilize internally developed computer software as part of our product offerings. In the development of a new software product, substantial consideration must be given by management to determine whether costs incurred are research and development costs, or internal software development costs eligible for capitalization. Management must consider a number of different factors during their evaluation of each computer software development project that includes estimates and assumptions. Costs considered to be research and development are expensed as incurred. After meeting specific requirements, internal software development costs are capitalized as incurred. The capitalization and ongoing assessment of recoverability of software development costs requires considerable judgment by management with respect to certain external factors, including, but not limited to, technological and economic feasibility, and estimated economic life. Amortization of capitalized software development costs begins when the product is ready for its intended use. Capitalized software development costs are amortized on a project basis using the straight-line method over the estimated economic life of the product or enhancement.
We evaluate the carrying value of capitalized software when circumstances indicate the carrying value may not be recoverable. The review of capitalized software for impairment requires significant assumptions and estimates about operating strategies, underlying technologies utilized, and external market factors. External market factors include, but are not limited to, expected levels of competition, barriers to entry by potential competitors, stability in the target market and governmental regulations.
Income Taxes:
We use the asset and liability method of accounting for income taxes. Under this method, income tax expense is recognized for the amount of taxes payable or refundable for the current year. In addition, deferred tax assets and liabilities are recognized for the expected future tax consequences of temporary differences between the financial reporting and tax bases of assets and liabilities, and for operating losses and tax credit carryforwards. Management must make assumptions, judgments and estimates to determine our current provision for income taxes and also deferred tax assets and liabilities and any valuation allowance to be recorded against a deferred tax asset.
Assumptions, judgments and estimates relative to the current provision for income taxes take into account current tax laws, interpretations of current tax laws and possible outcomes of current and future audits conducted by foreign and domestic tax authorities. We have established reserves for income taxes to address potential exposures involving tax positions that could be challenged by tax authorities. Although we believe the assumptions, judgments and estimates are reasonable, changes in tax laws or interpretations of tax laws and the resolution of any future tax audits could significantly impact the amounts provided for income taxes in the consolidated financial statements.
Assumptions, judgments and estimates relative to the value of a deferred tax asset take into account predictions of the amount and category of future taxable income, such as income from operations or capital gains income and from which subsidiary or jurisdiction such income is expected to be realized. Actual operating results and the underlying amount and category of income in future years could render the current assumptions, judgments and estimates of recoverable net
44
deferred taxes inaccurate. Any of the assumptions, judgments and estimates mentioned above could cause actual income tax obligations to differ from the estimates, thus materially impacting our financial position and results of operations.
Stock-Based Compensation:
Stock-based compensation cost for awards under share-based compensation plans is measured at the grant date based on the fair value of the award and is recognized as expense over the requisite service period, which is the vesting period. We currently use the Black-Scholes option pricing model to determine the fair value of stock option awards. The determination of the fair value of stock-based payment awards on the date of grant using an option-pricing model is affected by our stock price as well as various other assumptions. These assumptions include expected stock price volatility over the term of the awards, actual and projected employee stock option exercise behaviors, risk-free interest rate and expected dividends. We account for forfeitures as they occur. The amount of stock-based compensation expense for stock options that is recognized in a given period is dependent upon management’s estimate of when the financial vesting targets are expected to be achieved. If this estimate proves to be inaccurate, the remaining amount of stock-based compensation expense for stock options could be accelerated, spread out over a longer period, or reversed. We currently base expectations for these assumptions from historical data and other applicable factors. These expectations are subject to change in future periods.
Valuation of Assets Acquired in an Acquisition Including Goodwill and Intangible Assets:
We allocate the fair value of the total purchase price paid for acquisitions to the tangible assets acquired, liabilities assumed, and intangible assets acquired based on their estimated fair values. The excess of the fair value of the purchase price consideration over the fair values of these identifiable assets and liabilities is recorded as goodwill to reporting units based on the expected benefit from the business combination. Such valuations require management to make significant estimates and assumptions, especially with respect to intangible assets. Management's estimates of fair value are based upon assumptions believed to be reasonable, but which are inherently uncertain and unpredictable and, as a result, actual results may differ from estimates. Allocation of the purchase price consideration to identifiable assets and liabilities affects our amortization expense, as acquired finite-lived intangible assets are amortized over the useful life, whereas any indefinite-lived intangible assets, including goodwill, are not amortized. During the measurement period, which is not to exceed one year from the acquisition date, we may record adjustments to the assets acquired and liabilities assumed, with the corresponding offset to goodwill. Upon the conclusion of the measurement period, any subsequent adjustments are recorded to earnings.
Goodwill is tested for impairment at the reporting unit level annually or more frequently if events or changes in circumstances would more likely than not reduce the fair value of a reporting unit below its carrying value. We have four reporting units subject to goodwill impairment testing. As of December 31, 2024, no impairment of goodwill has been identified.
Intangible assets acquired in an acquisition are reviewed for possible impairment whenever events or circumstances indicate that the carrying amount of such assets may not be recoverable. The evaluation is performed at the lowest level for which identifiable cash flows are largely independent of the cash flows of other assets and liabilities. Recoverability of these assets is measured by a comparison of the carrying amounts to the future undiscounted cash flows the assets are expected to generate from the use and eventual disposition. If such review indicates that the carrying amount of intangible assets is not recoverable, the carrying amount is reduced to fair value. We have not recorded any material impairment charges during the years presented.
The useful lives of our finite-lived intangible assets are determined by management when those assets are initially recognized and are routinely reviewed for the remaining estimated useful lives. The current estimate of useful lives represents management’s best estimate based on current facts and circumstances, but may differ from the actual useful lives due to changes in future circumstances such as changes to our business operations, changes in the planned use of assets, and technological advancements. When we change the estimated useful life assumption for any asset, the remaining carrying amount of the asset is accounted for prospectively and depreciated or amortized over the revised estimated useful life.
The assessment of critical accounting policies and estimates is not meant to be an all-inclusive discussion of the uncertainties to financial results that can occur from the application of the full range of our accounting policies. Materially different financial results could occur in the application of other accounting policies as well. Also, materially different results can occur upon the adoption of new accounting standards.
Item 7A. Quantitative and Qualitative Disclosures About Market Risk.
Information required by this item is set forth under the captions "Our revenues and earnings are affected by changes in capital markets and significant changes in the value of financial instruments" and "Changes in interest rates may affect the value of our fixed-income investment securities" in Item 1A, Risk Factors and under the captions "Sensitivity of our
45
revenues and earnings to capital market fluctuations" and "SEI Integrated Cash Program" in Item 7, Management's Discussion and Analysis of Financial Condition and Results of Operations.
46
Item 8. Financial Statements and Supplementary Data.
| Index to Financial Statements: | Page | ||||
| Reports of Independent Registered Public Accounting Firm | |||||
Auditor Name: |
|||||
Audit Firm ID: |
|||||
Auditor Location: |
|||||
| Consolidated Balance Sheets — December 31, 2024 and 2023 | |||||
| Consolidated Statements of Operations — For the years ended December 31, 2024, 2023 and 2022 | |||||
| Consolidated Statements of Comprehensive Income — For the years ended December 31, 2024, 2023 and 2022 | |||||
| Consolidated Statements of Changes in Equity — For the years ended December 31, 2024, 2023 and 2022 | |||||
| Consolidated Statements of Cash Flows — For the years ended December 31, 2024, 2023 and 2022 | |||||
| Notes to Consolidated Financial Statements | |||||
| Schedule II - Valuation and Qualifying Accounts and Reserves — For the years ended December 31, 2024, 2023 and 2022 | |||||
All other schedules are omitted because they are not applicable, or not required, or because the required information is included in the Consolidated Financial Statements or notes thereto.
47
Report of Independent Registered Public Accounting Firm
To the Shareholders and Board of Directors
SEI Investments Company:
Opinion on the Consolidated Financial Statements
We have audited the accompanying consolidated balance sheets of SEI Investments Company and subsidiaries (the Company) as of December 31, 2024 and 2023, the related consolidated statements of operations, comprehensive income, changes in equity, and cash flows for each of the years in the three-year period ended December 31, 2024, and the related notes and financial statement schedule II referred to in Item 15(2) of this Form 10-K (collectively, the consolidated financial statements). In our opinion, the consolidated financial statements present fairly, in all material respects, the financial position of the Company as of December 31, 2024 and 2023, and the results of its operations and its cash flows for each of the years in the three-year period ended December 31, 2024, in conformity with U.S. generally accepted accounting principles.
We also have audited, in accordance with the standards of the Public Company Accounting Oversight Board (United States) (PCAOB), the Company’s internal control over financial reporting as of December 31, 2024, based on criteria established in Internal Control – Integrated Framework (2013) issued by the Committee of Sponsoring Organizations of the Treadway Commission, and our report dated February 20, 2025 expressed an unqualified opinion on the effectiveness of the Company’s internal control over financial reporting.
Basis for Opinion
These consolidated financial statements are the responsibility of the Company’s management. Our responsibility is to express an opinion on these consolidated financial statements based on our audits. We are a public accounting firm registered with the PCAOB and are required to be independent with respect to the Company in accordance with the U.S. federal securities laws and the applicable rules and regulations of the Securities and Exchange Commission and the PCAOB.
We conducted our audits in accordance with the standards of the PCAOB. Those standards require that we plan and perform the audit to obtain reasonable assurance about whether the consolidated financial statements are free of material misstatement, whether due to error or fraud. Our audits included performing procedures to assess the risks of material misstatement of the consolidated financial statements, whether due to error or fraud, and performing procedures that respond to those risks. Such procedures included examining, on a test basis, evidence regarding the amounts and disclosures in the consolidated financial statements. Our audits also included evaluating the accounting principles used and significant estimates made by management, as well as evaluating the overall presentation of the consolidated financial statements. We believe that our audits provide a reasonable basis for our opinion.
Critical Audit Matter
The critical audit matter communicated below is a matter arising from the current period audit of the consolidated financial statements that was communicated or required to be communicated to the audit committee and that: (1) relates to accounts or disclosures that are material to the consolidated financial statements and (2) involved our especially challenging, subjective, or complex judgments. The communication of a critical audit matter does not alter in any way our opinion on the consolidated financial statements, taken as a whole, and we are not, by communicating the critical audit matter below, providing a separate opinion on the critical audit matter or on the accounts or disclosures to which it relates.
Recoverability of SEI Wealth PlatformSM (SWP) Capitalized Software Development Costs
As discussed in Note 1 to the consolidated financial statements, the Company’s capitalized software development costs primarily relate to the further development of SWP. As of December 31, 2024, the net book value of SWP was $204,621. The Company evaluates the carrying value of capitalized software development costs when circumstances indicate the carrying value may not be recoverable. The review of capitalized software development costs for recoverability requires significant assumptions about operating strategies, underlying technologies utilized, and external market factors. External market factors include, but are not limited to, expected levels of competition, barriers to entry by potential competitors, stability in the target market and government regulations.
48
We identified the assessment of recoverability of SWP capitalized software costs as a critical audit matter. Assessing the Company’s identification of changes in circumstances that indicate the carrying value of SWP may not be recoverable involved subjective auditor judgement. The judgments included consideration of factors that are external and internal to the Company, such as operating strategies, underlying technologies utilized, and external market factors.
The following are the primary procedures we performed to address this critical audit matter. We evaluated the design and tested the operating effectiveness of certain internal controls related to the capitalized software development costs process. This included controls related to the Company’s assessment of circumstances indicating the carrying value of SWP capitalized software development costs may not be recoverable. We evaluated management’s assessment to identify changes in circumstances that indicate the carrying value of SWP may not be recoverable, including consideration of the Company’s operating strategies underlying technologies utilized, and external market factors by (1) inquiring of management responsible for SWP software development, (2) reading board of director minutes, shareholder presentations, press releases and available peer and industry information, and (3) analyzing the nature of SWP software costs capitalized in the current year.
/s/ KPMG LLP
We have served as the Company’s auditor since 2014.
Philadelphia, Pennsylvania
February 20, 2025
49
Report of Independent Registered Public Accounting Firm
To the Shareholders and Board of Directors
SEI Investments Company:
Opinion on Internal Control Over Financial Reporting
We have audited SEI Investments Company and subsidiaries' (the Company) internal control over financial reporting as of December 31, 2024, based on criteria established in Internal Control – Integrated Framework (2013) issued by the Committee of Sponsoring Organizations of the Treadway Commission. In our opinion, the Company maintained, in all material respects, effective internal control over financial reporting as of December 31, 2024, based on criteria established in Internal Control – Integrated Framework (2013) issued by the Committee of Sponsoring Organizations of the Treadway Commission.
We also have audited, in accordance with the standards of the Public Company Accounting Oversight Board (United States) (PCAOB), the consolidated balance sheets of the Company as of December 31, 2024 and December 31, 2023, the related consolidated statements of operations, comprehensive income, changes in equity, and cash flows for each of the years in the three-year period ended December 31, 2024, and the related notes and financial statement schedule II referred to in Item 15(2) of this From 10-K (collectively, the consolidated financial statements), and our report dated February 20, 2025 expressed an unqualified opinion on those consolidated financial statements.
Basis for Opinion
The Company’s management is responsible for maintaining effective internal control over financial reporting and for its assessment of the effectiveness of internal control over financial reporting, included in the accompanying Internal Control over Financial Reporting. Our responsibility is to express an opinion on the Company’s internal control over financial reporting based on our audit. We are a public accounting firm registered with the PCAOB and are required to be independent with respect to the Company in accordance with the U.S. federal securities laws and the applicable rules and regulations of the Securities and Exchange Commission and the PCAOB.
We conducted our audit in accordance with the standards of the PCAOB. Those standards require that we plan and perform the audit to obtain reasonable assurance about whether effective internal control over financial reporting was maintained in all material respects. Our audit of internal control over financial reporting included obtaining an understanding of internal control over financial reporting, assessing the risk that a material weakness exists, and testing and evaluating the design and operating effectiveness of internal control based on the assessed risk. Our audit also included performing such other procedures as we considered necessary in the circumstances. We believe that our audit provides a reasonable basis for our opinion.
Definition and Limitations of Internal Control Over Financial Reporting
A company’s internal control over financial reporting is a process designed to provide reasonable assurance regarding the reliability of financial reporting and the preparation of financial statements for external purposes in accordance with generally accepted accounting principles. A company’s internal control over financial reporting includes those policies and procedures that (1) pertain to the maintenance of records that, in reasonable detail, accurately and fairly reflect the transactions and dispositions of the assets of the company; (2) provide reasonable assurance that transactions are recorded as necessary to permit preparation of financial statements in accordance with generally accepted accounting principles, and that receipts and expenditures of the company are being made only in accordance with authorizations of management and directors of the company; and (3) provide reasonable assurance regarding prevention or timely detection of unauthorized acquisition, use, or disposition of the company’s assets that could have a material effect on the financial statements.
50
Because of its inherent limitations, internal control over financial reporting may not prevent or detect misstatements. Also, projections of any evaluation of effectiveness to future periods are subject to the risk that controls may become inadequate because of changes in conditions, or that the degree of compliance with the policies or procedures may deteriorate.
/s/ KPMG LLP
Philadelphia, Pennsylvania
February 20, 2025
51
| Consolidated Balance Sheets | SEI Investments Company | ||||||||||
| (Dollars in thousands, except per share data) | and Subsidiaries | ||||||||||
| December 31, | 2024 | 2023 | ||||||||||||
| Assets | ||||||||||||||
| Current Assets: | ||||||||||||||
| Cash and cash equivalents | $ |
|
$ | |||||||||||
| Restricted cash |
|
|||||||||||||
| Receivables from investment products |
|
|||||||||||||
Receivables, net of allowance for doubtful accounts of $ |
|
|||||||||||||
| Securities owned |
|
|||||||||||||
| Other current assets |
|
|||||||||||||
| Total Current Assets |
|
|||||||||||||
Property and Equipment, net of accumulated depreciation of $ |
|
|||||||||||||
Operating Lease Right-of-Use Assets |
|
|||||||||||||
Capitalized Software, net of accumulated amortization of $ |
|
|||||||||||||
| Investments |
|
|||||||||||||
| Goodwill |
|
|||||||||||||
Intangible Assets, net of accumulated amortization of $ |
|
|||||||||||||
| Deferred Contract Costs |
|
|||||||||||||
| Deferred Income Taxes |
|
|||||||||||||
Other Assets, net
|
|
|||||||||||||
| Total Assets | $ |
|
$ | |||||||||||
The accompanying notes are an integral part of these consolidated financial statements.
52
| Consolidated Balance Sheets | SEI Investments Company | ||||||||||
| (Dollars in thousands, except per-share data) | and Subsidiaries | ||||||||||
| December 31, | 2024 | 2023 | ||||||||||||
| Liabilities and Equity | ||||||||||||||
| Current Liabilities: | ||||||||||||||
| Accounts payable | $ |
|
$ | |||||||||||
| Accrued liabilities |
|
|||||||||||||
| Current portion of long-term operating lease liabilities |
|
|||||||||||||
| Deferred revenue |
|
|||||||||||||
| Total Current Liabilities |
|
|||||||||||||
| Long-term Income Taxes Payable |
|
|||||||||||||
| Long-term Operating Lease Liabilities |
|
|||||||||||||
| Other Long-term Liabilities |
|
|||||||||||||
| Total Liabilities |
|
|||||||||||||
| Commitments and Contingencies | ||||||||||||||
| Shareholders' Equity: | ||||||||||||||
Common stock, $ |
|
|||||||||||||
| Capital in excess of par value |
|
|||||||||||||
| Retained earnings |
|
|||||||||||||
| Accumulated other comprehensive loss, net | ( |
( |
||||||||||||
| Total Shareholders' Equity |
|
|||||||||||||
| Total Liabilities and Equity | $ |
|
$ | |||||||||||
The accompanying notes are an integral part of these consolidated financial statements.
53
| Consolidated Statements of Operations | SEI Investments Company | |||||||
| (Dollars in thousands, except per-share data) | and Subsidiaries | |||||||
| Year Ended December 31, | 2024 | 2023 | 2022 | |||||||||||||||||
| Revenues: | ||||||||||||||||||||
| Asset management, administration and distribution fees | $ |
|
$ | $ | ||||||||||||||||
| Information processing and software servicing fees |
|
|||||||||||||||||||
| Total revenues |
|
|||||||||||||||||||
| Expenses: | ||||||||||||||||||||
| Subadvisory, distribution and other asset management costs |
|
|||||||||||||||||||
| Software royalties and other information processing costs |
|
|||||||||||||||||||
| Compensation, benefits and other personnel |
|
|||||||||||||||||||
| Stock-based compensation |
|
|||||||||||||||||||
| Consulting, outsourcing and professional fees |
|
|||||||||||||||||||
| Data processing and computer related |
|
|||||||||||||||||||
| Facilities, supplies and other costs |
|
|||||||||||||||||||
| Amortization |
|
|||||||||||||||||||
| Depreciation |
|
|||||||||||||||||||
| Total expenses |
|
|||||||||||||||||||
| Income from operations |
|
|||||||||||||||||||
| Net gain (loss) from investments |
|
( |
||||||||||||||||||
| Interest and dividend income |
|
|||||||||||||||||||
| Interest expense | ( |
( |
( |
|||||||||||||||||
| Other income |
|
|||||||||||||||||||
| Equity in earnings of unconsolidated affiliates |
|
|||||||||||||||||||
| Income before income taxes |
|
|||||||||||||||||||
| Income taxes |
|
|||||||||||||||||||
| Net income | $ |
|
$ | $ | ||||||||||||||||
| Basic earnings per common share | $ |
|
$ | $ | ||||||||||||||||
| Shares used to compute basic earnings per share |
|
|||||||||||||||||||
| Diluted earnings per common share | $ |
|
$ | $ | ||||||||||||||||
| Shares used to compute diluted earnings per share |
|
|||||||||||||||||||
| Dividends declared per common share | $ |
|
$ | $ | ||||||||||||||||
The accompanying notes are an integral part of these consolidated financial statements.
54
| Consolidated Statements of Comprehensive Income | SEI Investments Company | |||||||
| (Dollars in thousands) | and Subsidiaries | |||||||
| Year Ended December 31, | 2024 | 2023 | 2022 | |||||||||||||||||
| Net income | $ |
|
$ | $ | ||||||||||||||||
| Other comprehensive (loss) income, net of tax: | ||||||||||||||||||||
| Foreign currency translation adjustments | ( |
( |
||||||||||||||||||
| Unrealized holding (loss) gain on investments: | ||||||||||||||||||||
Unrealized holding (losses) gains during the period, net of income taxes of $ |
( |
( |
||||||||||||||||||
Less: reclassification adjustment for (gains) losses realized in net income, net of income taxes of $ |
( |
|||||||||||||||||||
| Total other comprehensive (loss) income, net of taxes | ( |
( |
||||||||||||||||||
| Comprehensive income | $ |
|
$ | $ | ||||||||||||||||
The accompanying notes are an integral part of these consolidated financial statements.
55
| Consolidated Statements of Changes in Equity | SEI Investments Company | |||||||
| (Dollars in thousands, except per-share data) | and Subsidiaries | |||||||
| Year Ended December 31, | 2024 | 2023 | 2022 | |||||||||||||||||
| Shares of Common Stock | ||||||||||||||||||||
| Beginning balance |
|
|||||||||||||||||||
| Purchase and retirement of common stock | ( |
( |
( |
|||||||||||||||||
| Issuance of common stock under the employee stock purchase plan |
|
|||||||||||||||||||
| Issuance of common stock under share-based award plans |
|
|||||||||||||||||||
| Ending balance |
|
|||||||||||||||||||
| Common Stock | ||||||||||||||||||||
| Beginning balance | $ |
|
$ | $ | ||||||||||||||||
| Purchase and retirement of common stock | ( |
( |
( |
|||||||||||||||||
| Issuance of common stock under the employee stock purchase plan |
|
|||||||||||||||||||
| Issuance of common stock under share-based award plans |
|
|||||||||||||||||||
| Ending balance | $ |
|
$ | $ | ||||||||||||||||
| Capital In Excess of Par Value | ||||||||||||||||||||
| Beginning balance | $ |
|
$ | $ | ||||||||||||||||
| Purchase and retirement of common stock | ( |
( |
( |
|||||||||||||||||
| Issuance of common stock under the employee stock purchase plan |
|
|||||||||||||||||||
| Issuance of common stock under share-based award plans |
|
|||||||||||||||||||
| Stock-based compensation |
|
|||||||||||||||||||
| Ending balance | $ |
|
$ | $ | ||||||||||||||||
| Retained Earnings | ||||||||||||||||||||
| Beginning balance | $ |
|
$ | $ | ||||||||||||||||
| Net income |
|
|||||||||||||||||||
| Purchase and retirement of common stock | ( |
( |
( |
|||||||||||||||||
Dividends declared ($ |
( |
( |
( |
|||||||||||||||||
| Ending balance | $ |
|
$ | $ | ||||||||||||||||
| Accumulated Other Comprehensive Loss | ||||||||||||||||||||
| Beginning balance | $ | ( |
$ | ( |
$ | ( |
||||||||||||||
| Other comprehensive (loss) income | ( |
( |
||||||||||||||||||
| Ending balance | $ | ( |
$ | ( |
$ | ( |
||||||||||||||
| Total Equity | $ |
|
$ | $ | ||||||||||||||||
The accompanying notes are an integral part of these consolidated financial statements.
56
| Consolidated Statements of Cash Flows | SEI Investments Company | |||||||
| (Dollars in thousands) | and Subsidiaries | |||||||
| Year Ended December 31, | 2024 | 2023 | 2022 | |||||||||||||||||
| Cash flows from operating activities: | ||||||||||||||||||||
| Net income | $ |
|
$ | $ | ||||||||||||||||
Adjustments to reconcile net income to net cash provided by operating activities: |
||||||||||||||||||||
| Depreciation |
|
|||||||||||||||||||
| Amortization |
|
|||||||||||||||||||
| Equity in earnings of unconsolidated affiliates | ( |
( |
( |
|||||||||||||||||
| Partner distributions received from unconsolidated affiliate |
|
|||||||||||||||||||
| Stock-based compensation |
|
|||||||||||||||||||
| Provision for losses on receivables |
|
( |
( |
|||||||||||||||||
| Deferred income tax benefit | ( |
( |
( |
|||||||||||||||||
| Net (gain) loss from investments | ( |
( |
||||||||||||||||||
| Net gain from sale of property | ( |
|||||||||||||||||||
| Change in other long-term liabilities | ( |
|||||||||||||||||||
| Change in other assets | ( |
( |
||||||||||||||||||
| Contract costs capitalized, net of amortization | ( |
( |
( |
|||||||||||||||||
| Contingent consideration fair value adjustment | ( |
|||||||||||||||||||
| Write off of fixed assets and capitalized software |
|
|||||||||||||||||||
| Other | ( |
( |
( |
|||||||||||||||||
| Change in current assets and liabilities: | ||||||||||||||||||||
| Receivables from investment products |
|
( |
||||||||||||||||||
| Receivables | ( |
( |
( |
|||||||||||||||||
| Other current assets |
|
( |
( |
|||||||||||||||||
| Advances due from unconsolidated affiliate | ( |
( |
||||||||||||||||||
| Accounts payable |
|
( |
||||||||||||||||||
| Accrued liabilities |
|
( |
||||||||||||||||||
| Deferred revenue | ( |
|||||||||||||||||||
| Total adjustments |
|
( |
||||||||||||||||||
| Net cash provided by operating activities | $ |
|
$ | $ | ||||||||||||||||
The accompanying notes are an integral part of these consolidated financial statements.
57
| Consolidated Statements of Cash Flows | SEI Investments Company | |||||||
| (Dollars in thousands) | and Subsidiaries | |||||||
| Year Ended December 31, | 2024 | 2023 | 2022 | |||||||||||||||||
| Cash flows from investing activities: | ||||||||||||||||||||
| Additions to property and equipment | ( |
( |
( |
|||||||||||||||||
| Additions to capitalized software | ( |
( |
( |
|||||||||||||||||
| Purchases of marketable securities | ( |
( |
( |
|||||||||||||||||
| Purchases of interest in limited partnerships | ( |
|||||||||||||||||||
| Prepayments and maturities of marketable securities |
|
|||||||||||||||||||
| Sales of marketable securities |
|
|||||||||||||||||||
| Proceeds from fixed asset dispositions |
|
|||||||||||||||||||
| Cash paid for acquisitions, net of cash acquired | ( |
( |
||||||||||||||||||
| Proceeds from insurance settlements |
|
|||||||||||||||||||
| Other investing activities | ( |
( |
( |
|||||||||||||||||
| Net cash used in investing activities | ( |
( |
( |
|||||||||||||||||
| Cash flows from financing activities: | ||||||||||||||||||||
| Payments under revolving credit facility |
|
( |
||||||||||||||||||
| Payment of contingent consideration |
|
( |
( |
|||||||||||||||||
| Purchase and retirement of common stock | ( |
( |
( |
|||||||||||||||||
| Proceeds from issuance of common stock |
|
|||||||||||||||||||
| Payment of dividends | ( |
( |
( |
|||||||||||||||||
| Net cash used in financing activities | ( |
( |
( |
|||||||||||||||||
| Effect of exchange rate changes on cash, cash equivalents and restricted cash | ( |
( |
||||||||||||||||||
| Net increase (decrease) in cash, cash equivalents and restricted cash |
|
( |
||||||||||||||||||
| Cash, cash equivalents and restricted cash, beginning of year |
|
|||||||||||||||||||
| Cash, cash equivalents and restricted cash, end of year | $ |
|
$ | $ | ||||||||||||||||
| Interest paid | $ |
|
$ | $ | ||||||||||||||||
| Income taxes paid | $ |
|
$ | $ | ||||||||||||||||
| Non-cash investing and financing activities | ||||||||||||||||||||
| Acquisition of businesses in current assets, property and equipment, current liabilities and other long-term liabilities | $ |
|
$ | $ | ||||||||||||||||
| Dividends declared but not paid | $ |
|
$ | $ | ||||||||||||||||
The accompanying notes are an integral part of these consolidated financial statements.
58
| Notes to Consolidated Financial Statements | SEI Investments Company | |||||||
| (all figures are in thousands except share and per-share data) | and Subsidiaries | |||||||
Note 1 – Summary of Significant Accounting Policies
Nature of Operations
SEI Investments Company (the Company), a Pennsylvania corporation, is a leading global provider of financial technology, operations, and asset management services within the financial services industry.
Investment processing platforms provide technologies and business process outsourcing services for wealth managers. These solutions include investment advisory, client relationship, and other technology-enabled capabilities for the front office; administrative and investment services for the middle office; and accounting and processing services for the back office. Revenues from investment processing services are recognized in Information processing and software servicing fees on the accompanying Consolidated Statements of Operations.
Investment operations platforms provide business process outsourcing services for investment managers and asset owners. These platforms support a broad range of traditional and alternative investments and provide technology-enabled information analytics and investor capabilities for the front office; administrative and investment services for the middle office; and fund administration and accounting services for the back office. Revenues from investment operations services are recognized in Asset management, administration and distribution fees on the accompanying Consolidated Statements of Operations.
Investment management platforms provide comprehensive solutions for managing personal and institutional wealth. These platforms include goals-based investment strategies; SEI-sponsored and third-party investment products, including mutual funds, ETFs, collective investment products, alternative investment portfolios and separately managed accounts (SMA); and other market-specific advice, technology and operational components. These services are offered to wealth managers as part of a complete goals-based investment program for their end-investors. For institutional investors, the Company provides an Outsourced Chief Investment Officer (OCIO) platform and Unbundled OCIO platform that include investment management programs, as well as advisory and administrative services. Revenues from investment management services are recognized in Asset management, administration and distribution fees on the accompanying Consolidated Statements of Operations.
Principles of Consolidation
The Consolidated Financial Statements include the accounts of the Company and its wholly-owned subsidiaries and entities in which it holds a controlling financial interest. The Company determines whether it has a controlling financial interest either by its decision-making ability through voting interests or by the extent of the Company’s participation in the economic risks and rewards of the entity through variable interests. All intercompany accounts and transactions have been eliminated.
Variable Interest Entities
The Company or its affiliates have created numerous investment products for its clients in various types of legal entity structures. The Company serves as the Manager, Administrator and Distributor for these investment products and may also serve as the Trustee for some of the investment products. The Company receives asset management, distribution, administration and custodial fees for these services. Clients are the equity investors and participate in proportion to their ownership percentage in the net income or loss and net capital gains or losses of the products, and, on liquidation, will participate in proportion to their ownership percentage in the remaining net assets of the products after satisfaction of outstanding liabilities.
The Company has concluded that it is not the primary beneficiary of the entities and, therefore, is not required to consolidate any of the pooled investment vehicles for which it receives asset management, distribution, administration and custodial fees under the VIE model. The entities either do not meet the definition of a VIE or the Company does not hold a variable interest in the entities. The entities either qualify for the money market scope exception, or are entities in which the Company’s asset management, distribution, administration and custodial fees are commensurate with the services provided and include fair terms and conditions, or are entities that are limited partnerships which have substantive kick-out rights. The Company acts as a fiduciary and does not hold any other interests other than insignificant seed money investments in the pooled investment vehicles. For this reason, the Company also concluded that it is not required to consolidate the pooled investment vehicles under the voting interest entity model.
59
Management’s Use of Estimates
The preparation of financial statements in conformity with accounting principles generally accepted in the United States (U.S. GAAP) requires management to make estimates and assumptions that affect the reported amounts of assets and liabilities and disclosure of contingent assets and liabilities at the date of the financial statements and the reported amounts of revenues and expenses during the reporting period. Actual results could differ from those estimates.
Revenue Recognition
Revenue is recognized when the transfer of control of promised goods or services under the terms of a contract with customers are satisfied in an amount that reflects the consideration to which the Company expects to be entitled in exchange for those promised goods or services. Certain portions of the Company’s revenues involve a third party in providing goods or services to its customers. In such circumstances, the Company must determine whether the nature of its promise to the customer is to provide the underlying goods or services (the Company is the principal in the transaction and reports the transaction gross) or to arrange for a third party to provide the underlying goods or services (the entity is the agent in the transaction and reports the transaction net). The Company does not disclose the value of unsatisfied performance obligations as the majority of its contracts relate to: 1) contracts with an original term of one year or less; 2) contracts for which the Company recognizes revenue at the amount to which it has the right to invoice for services performed; and 3) contracts that are based on the value of assets under management or administration. See Note 17 for related disclosures regarding revenue recognition.
Cash and Cash Equivalents
The Company considers investment instruments purchased with an original maturity of three months or less to be cash equivalents. Cash and cash equivalents include $341,311 and $397,838 at December 31, 2024 and 2023, respectively, primarily invested in SEI-sponsored open-ended money market investment products. The SEI-sponsored investment products are considered Level 1 assets.
Restricted Cash
Restricted cash includes $250 52 and $51 at December 31, 2024 and 2023, respectively, segregated in special reserve accounts for the benefit of customers of the Company's subsidiary SEI Investments Distribution Co. (SIDCO) in accordance with certain rules established by the Securities and Exchange Commission for broker-dealers.
Allowances for Doubtful Accounts
The Company provides an allowance for doubtful accounts equal to the estimated uncollectible amounts. The Company’s estimate is based on historical collection experience and a review of the current status of trade accounts receivable.
Concentration of Credit Risk
Financial instruments which potentially expose the Company to concentrations of credit risk consist primarily of cash equivalents and trade receivables. Cash equivalents are principally invested in short-term money market funds or placed with major banks and high-credit qualified financial institutions. Cash deposits maintained with institutions are in excess of federally insured limits. Concentrations of credit risk with respect to the Company's receivables are limited due to the large number of clients and their dispersion across geographic areas. No single group or customer represents greater than 10% of total accounts receivable.
Property and Equipment
Property and Equipment are recorded at cost. Expenditures for major additions and improvements are capitalized and minor replacements, maintenance, and repairs are charged to expense as incurred. Construction in progress includes the cost of construction and other direct costs attributable to the construction. When property and equipment are retired or disposed of, the related cost and accumulated depreciation are removed from the accounts and any resulting gain or loss is included in the results of operations for the respective period. Depreciation is provided over the estimated useful lives using the straight line method for financial statement purposes. No provision for depreciation is made for construction in progress until such time as the relevant assets are completed and put into service. The Company uses other depreciation methods, generally accelerated, for tax purposes where appropriate. Buildings are depreciated over 25 to 39 years. Building improvements have useful lives ranging from 5 to 15 years. Equipment, purchased software and furniture and fixtures have useful lives ranging from 3 5
Investments
The classification of the Company's investments is determined at the time of purchase and reevaluated at each balance sheet date. The Company records its investments in money market funds and commercial paper as cash equivalents. The
60
Company records its investments in securities owned by SIDCO, equity securities and other investment securities not accounted for under the equity method at fair value. Unrealized gains and losses from the change in fair value of these securities are recognized in current period earnings.
The specific identification method is used to compute the realized gains and losses on all of the Company’s investments (See Note 5).
Securities owned
SIDCO, the Company’s broker-dealer subsidiary, reports changes in fair value of marketable securities through current period earnings due to specialized accounting practices related to investments by broker-dealers.
Available for sale debt securities
Debt securities classified as available-for-sale are reported at fair value as determined by the most recently traded price of each security at the balance sheet date. Unrealized gains and losses associated with the Company's available for sale debt securities, net of income taxes, are reported as a separate component of comprehensive income. The Company evaluates the realizable value of its available for sale debt securities on a quarterly basis. In the event that an other-than-temporary decline in fair value has occurred, the amount of the decline related to a credit loss is reported through current period earnings. Some of the factors considered in determining other-than-temporary impairment include, but are not limited to, the intent of management to sell the security, the likelihood that the Company will be required to sell the security before recovering its cost, and management’s expectation to recover the entire amortized cost basis of the security even if there is no intent to sell the security. The Company did no
Equity method investments
Fair Value of Financial Instruments
Fair value is defined as the exchange price that would be received for an asset or paid to transfer a liability (an exit price) in the principal or most advantageous market for the asset or liability in an orderly transaction between market participants on the measurement date. The fair value hierarchy requires an entity to maximize the use of observable inputs and minimize the use of unobservable inputs when measuring fair value. The fair value hierarchy describes three levels of inputs that may be used by the Company to measure fair value:
Level 1 – Quoted prices in active markets for identical assets or liabilities without adjustment. The Company’s Level 1 assets primarily include investments in investment products sponsored by SEI that are quoted daily.
Level 2 – Observable inputs other than Level 1 prices, such as quoted prices for similar assets, quoted prices in markets that are not active, or other inputs that are observable or can be corroborated by observable market data for substantially the full term of the assets or liabilities. Level 2 financial assets consist of GNMA mortgage-backed securities, Federal Home Loan Bank (FHLB) and other U.S. government agency short-term notes.
Level 3 – Unobservable inputs that are supported by little or no market activity and that are significant to the fair value of the assets or liabilities. Level 3 assets and liabilities include financial instruments whose value is determined using pricing models, or similar techniques, as well as instruments for which the determination of fair value requires significant judgment by management. The Company had no Level 3 financial assets at December 31, 2024 or 2023 that were required to be measured at fair value on a recurring basis. The Company's Level 3 financial liabilities at December 31, 2024 and 2023 consist entirely of estimated contingent considerations resulting from business acquisitions.
The fair value of an asset or liability may include inputs from more than one level in the fair value hierarchy. The lowest level of significant inputs used to value the asset or liability determines which level the asset or liability is classified in its entirety. Transfers between levels of the fair value hierarchy are reported at fair value as of the beginning of the period in which the transfers occur. See Note 4 for related disclosures regarding fair value measurements.
61
Capitalized Software
Costs incurred for the development of internal use software to be offered in a hosting arrangement is capitalized during the development stage of the software application. These costs include direct external and internal costs to design the software configuration and interfaces, coding, installation, and testing. Costs incurred during the preliminary and post-implementation stages of the software application are expensed as incurred. Costs associated with significant enhancements to a software application are capitalized while costs incurred to maintain existing software applications are expensed as incurred. The capitalization of software development costs requires considerable judgment by management to ensure the costs incurred will result in additional functionality of the software. Amortization of capitalized software development costs begins when the product is ready for its intended use. Capitalized software development costs are amortized on a product-by-product basis using the straight-line method over the estimated economic life of the product or enhancement.
The Company capitalized $24,340 , $33,958 and $35,293 of software development costs during 2024, 2023 and 2022, respectively, to further the development of the SEI Wealth PlatformSM (SWP) and the development of a new platform for the Investment Managers segment. The Company capitalized $13,696 , $18,183 and $25,735 of software development costs for significant enhancements to SWP during 2024, 2023 and 2022, respectively. As of December 31, 2024, the net book value of SWP was $204,621 , which includes $4,300 of capitalized software development costs in-progress associated with future releases.
The Company also capitalized $10,644 , $15,775 and $9,558 of software development costs during 2024, 2023 and 2022, respectively, related to a new platform for the Investment Managers segment. Capitalized software development costs in-progress associated with this platform were $30,812 and $20,083 as of December 31, 2024 and 2023, respectively. The platform is not yet ready for use.
Management continually reassesses the estimated useful life of SWP and any change in management’s estimate could result in the remaining amortization expense to be accelerated or spread out over a longer period. As of December 31, 2024, SWP has a weighted average remaining life of 8.2 years. Amortization expense for SWP was $27,510 , $25,637 and $35,638 in 2024, 2023 and 2022, respectively, and is included in Amortization expense on the accompanying Consolidated Statements of Operations.
The Company currently expects to recognize amortization expense related to all capitalized software development costs placed into service as of December 31, 2024 each year from 2025 through 2029 as follows:
| Year | Expected Amortization Expense Related to Capitalized Software | ||||
| 2025 | $ | ||||
| 2026 | |||||
| 2027 | |||||
| 2028 | |||||
| 2029 | |||||
The Company evaluates the carrying value of capitalized software development costs when circumstances indicate the carrying value may not be recoverable. The review of capitalized software development costs for impairment requires significant assumptions about operating strategies, underlying technologies utilized, and external market factors. External market factors include, but are not limited to, expected levels of competition, barriers to entry by potential competitors, stability in the target market and governmental regulations. During 2023, management decided to abandon certain functionality within the platform for the Investment Managers segment due to a change in development strategy and wrote off $5,250 of previously capitalized software development costs. The expense associated with the write off is reflected in the Investment Managers segment and included in Facilities, supplies and other costs on the accompanying Consolidated Statement of Operations. The Company did no
Business Combinations
The Company accounts for business combinations in accordance with Accounting Standards Codification (ASC) Topic 805, Business Combinations (ASC 805). ASC 805 establishes principles and requirements for recognizing the total consideration transferred, assets acquired and liabilities assumed in a business combination. ASC 805 also provides guidance for recognizing and measuring goodwill acquired in a business combination and requires the acquirer to disclose information needed to evaluate and understand the financial impact of the business combination. The Company recognizes assets and liabilities acquired at their estimated fair values. Management uses judgment to identify the acquired assets and liabilities assumed; estimate the fair value of these assets and liabilities; estimate the useful life of the
62
assets; and assess the appropriate method for recognizing depreciation or amortization expense over the estimated useful life of the assets.
Goodwill and Other Intangible Assets
The Company reviews long-lived assets and identifiable definite-lived intangible assets for impairment at least annually or whenever events or changes in circumstances indicate that the carrying amount of these assets may not be recoverable. For purposes of recognizing and measuring an impairment loss, a long-lived asset is grouped with other assets and liabilities at the lowest level for which identifiable cash flows are largely independent.
Identifiable definite-lived intangible assets on the Company’s Consolidated Balance Sheet are amortized on a straight-line basis according to their estimated useful lives. Goodwill is not amortized but is reviewed for impairment annually or more frequently if an event occurs or circumstances change that would more likely than not reduce the fair value of a reporting unit below its carrying amount. Current guidance requires that a qualitative assessment be performed to assess goodwill for impairment. The fair value of each reporting unit is compared with its carrying value, including goodwill. If the fair value exceeds the carrying value, goodwill is not impaired and no further testing is performed. If the qualitative assessment indicates the carrying value exceeds the fair value, a quantitative impairment test is then utilized to identify potential goodwill impairment and measure the amount of a goodwill impairment loss to be recognized. The Company did no
Contingent Consideration Liabilities
Income Taxes
Foreign Currency Translation
The assets and liabilities and results of operations of the Company’s foreign subsidiaries are measured using the foreign subsidiary’s local currency as the functional currency. Assets and liabilities have been translated into U.S. dollars using the rates of exchange at the balance sheet dates. The results of operations have been translated into U.S. dollars at average exchange rates prevailing during the period. The resulting translation gain and loss adjustments are recorded as a separate component of comprehensive income.
Earnings Per Common Share
63
The calculations of basic and diluted earnings per share for 2024, 2023 and 2022 are:
| 2024 | 2023 | 2022 | ||||||||||||||||||
| Net income | $ |
|
$ | $ | ||||||||||||||||
| Shares used to compute basic earnings per common share |
|
|||||||||||||||||||
| Dilutive effect of equity awards |
|
|||||||||||||||||||
| Shares used to compute diluted earnings per common share |
|
|||||||||||||||||||
| Basic earnings per common share | $ |
|
$ | $ | ||||||||||||||||
| Diluted earnings per common share | $ |
|
$ | $ | ||||||||||||||||
Employee stock options to purchase approximately 9,530,000 , 11,388,000 and 12,439,000 shares of common stock, with an average exercise price per share of $61.83 , $61.32 and $60.35 , were outstanding during 2024, 2023 and 2022, respectively, but not included in the computation of diluted earnings per common share because either the performance conditions have not been satisfied or the option’s exercise price was greater than the average market price of the Company’s common stock and the effect on diluted earnings per common share would have been anti-dilutive. Restricted stock units not included in the computation of diluted earnings per common share were immaterial during 2024, 2023 and 2022 (See Note 7).
Stock-Based Compensation
Leases
The Company determines if an arrangement is a lease at the inception of the contract. The Company's operating leases are included in Operating lease right-of-use (ROU) assets, Current portion of long-term operating lease liabilities, and Long-term operating lease liabilities on the accompanying Consolidated Balance Sheets.
The operating lease ROU assets and operating lease liabilities are recognized based on the present value of future minimum lease payments over the lease term at commencement date. As most of the Company’s leases do not provide an implicit interest rate, the Company utilizes an estimated incremental borrowing rate based on the information available at commencement date in determining the present value of future payments. In determining the discount rate used in the present value calculation, the Company has elected to apply the portfolio approach for leases of equipment provided the leases commenced at or around the same time. This election allows the Company to account for leases at a portfolio level provided that the resulting accounting at this level would not differ materially from the accounting at the individual lease level. Lease expense for minimum lease payments is recognized on a straight-line basis over the lease term.
The Company has elected to account for lease and non-lease components separately. Operating lease ROU assets include all contractual lease payments and initial direct costs incurred, less any lease incentives. Facility leases generally only contain lease expense and non-component items such as taxes and pass through charges. Only the lease components are included in the ROU assets and lease liabilities. Additionally, the Company has elected not to apply the recognition requirements of ASC 842 to leases which have a lease term of less than one year at the commencement date.
Reclassifications
Certain prior year amounts have been reclassified to conform to current year presentation.
64
Recently Adopted Accounting Pronouncements
In November 2023, the Financial Accounting Standards Board (FASB) issued ASU 2023-07, Segment Reporting (Topic 280): Improvements to Reportable Segment Disclosures (ASU 2023-07) which updates reportable segment disclosure requirements primarily through enhanced disclosures about significant segment expenses. Business segments are defined as components of an enterprise about which separate financial information is available that is evaluated regularly by the chief operating decision maker (CODM) in deciding how to allocate resources and in assessing performance. The Company adopted ASU 2023-07 for the fiscal year ended December 31, 2024 and applied the disclosure requirements retrospectively to all prior periods presented in the financial statements. See Note 12 for related disclosures regarding the Company's business segments.
New Accounting Pronouncements
In December 2023, the Financial Accounting Standards Board (FASB) issued ASU 2023-09, Income Taxes (Topic 740): Improvement to Income Tax Disclosures (ASU 2023-09) to enhance the transparency and decision usefulness of income tax disclosures. ASU 2023-09 is effective for annual periods beginning after December 15, 2024 on a prospective basis. Early adoption is permitted. The Company does not expect ASU 2023-09 to have a significant impact on its consolidated financial statements and related disclosures.
In November 2024, the FASB issued ASU 2024-03, Income Statement—Reporting Comprehensive Income—Expense Disaggregation Disclosures (Subtopic 220-40): Disaggregation of Income Statement Expenses (ASU 2024-03) which requires new disclosures to disaggregate prescribed natural expenses underlying any income statement caption. ASU 2024-03 is effective for annual periods beginning after December 15, 2026 on a prospective basis. Early adoption is permitted. The Company is currently evaluating the impact of adopting ASU 2024-03 on its consolidated financial statements and related disclosures.
Note 2 – Equity Method Investments
LSV Asset Management
The Company has an investment in the general partnership LSV Asset Management (LSV), a registered investment advisor that provides investment advisory services primarily to institutions, including pension plans and investment companies. LSV is currently an investment sub-advisor for a limited number of SEI-sponsored investment products. As of December 31, 2024, the Company's total partnership interest in LSV was approximately 38.6 %.
The Company accounts for its interest in LSV using the equity method because of its less than 50% ownership. The Company’s interest in the earnings of LSV is reflected in Equity in earnings of unconsolidated affiliates on the accompanying Consolidated Statements of Operations.
At December 31, 2024 and 2023, the Company’s total investment in LSV was $114,299 and $110,781 , respectively, and is included in Investments on the accompanying Consolidated Balance Sheets (See Note 5). The Company’s proportionate share in the earnings of LSV was $135,741 , $126,930 and $120,667 in 2024, 2023 and 2022, respectively. The Company receives partnership distributions related to the earnings of LSV on a quarterly basis. As such, the Company considers these distribution payments as returns on investment rather than returns of the Company's original investment in LSV and has therefore classified the associated cash inflows as an operating activity on the Consolidated Statements of Cash Flows. The Company received partnership distribution payments from LSV of $139,119 , $121,582 and $120,849 in 2024, 2023 and 2022, respectively.
These tables contain condensed financial information of LSV:
|
Condensed Statement of Operations
Year ended December 31,
|
2024 | 2023 | 2022 | |||||||||||||||||
| Revenues | $ |
|
$ | $ | ||||||||||||||||
| Net income | $ |
|
$ | $ | ||||||||||||||||
65
|
Condensed Balance Sheets
December 31,
|
2024 | 2023 | ||||||||||||
| Current assets | $ |
|
$ | |||||||||||
| Non-current assets |
|
|||||||||||||
| Total assets | $ |
|
$ | |||||||||||
| Current liabilities | $ |
|
$ | |||||||||||
| Non-current liabilities |
|
|||||||||||||
| Partners’ capital |
|
|||||||||||||
| Total liabilities and partners’ capital | $ |
|
$ | |||||||||||
Other Equity Method Investments
The Company's other equity method investments consist of an investment in a non-affiliated limited partnership in which the Company holds a more than minor interest. At December 31, 2024, the Company’s total investment in the limited partnership was $9,483 and is included in Investments on the accompanying Consolidated Balance Sheets (See Note 5). The Company did not hold any interest in the limited partnership at December 31, 2023.
Note 3 – Composition of Certain Financial Statement Captions
Receivables
Receivables on the accompanying Consolidated Balance Sheets consist of:
| 2024 | 2023 | |||||||||||||
| Trade receivables | $ |
|
$ | |||||||||||
| Fees earned, not billed |
|
|||||||||||||
| Other receivables |
|
|||||||||||||
|
|
||||||||||||||
| Less: Allowance for doubtful accounts | ( |
( |
||||||||||||
| Receivables, net | $ |
|
$ | |||||||||||
Fees earned, not billed represents receivables from contracts from customers earned but unbilled and results from timing differences between services provided and contractual billing schedules. These billing schedules generally provide for fees to be billed on a quarterly basis. In addition, certain fees earned from investment operations services are calculated based on assets under administration that have an extended valuation process. Billings to these clients occur once the asset valuation processes are completed.
Property and Equipment
Property and Equipment on the accompanying Consolidated Balance Sheets consists of:
| 2024 | 2023 | |||||||||||||
| Buildings | $ |
|
$ | |||||||||||
| Equipment |
|
|||||||||||||
| Land |
|
|||||||||||||
| Purchased software |
|
|||||||||||||
| Furniture and fixtures |
|
|||||||||||||
| Leasehold improvements |
|
|||||||||||||
| Construction in progress |
|
|||||||||||||
|
|
||||||||||||||
| Less: Accumulated depreciation | ( |
( |
||||||||||||
| Property and Equipment, net | $ |
|
$ | |||||||||||
Depreciation expense related to property and equipment for 2024, 2023 and 2022 was $33,358 , $35,300 and $33,657 , respectively.
Deferred Contract Costs
The Company's incremental contract acquisition costs are related to information processing contracts in the Private Banks segment and investment operations contracts in the Investment Managers segment. These deferred costs primarily
66
Deferred contract costs were $45,855 and $40,221 as of December 31, 2024 and 2023, respectively. The Company deferred expenses related to contract costs of $16,473 , $11,342 and $12,751 during 2024, 2023 and 2022, respectively. Amortization expense related to deferred contract costs were $10,839 , $9,049 and $11,059 during 2024, 2023 and 2022, respectively, and is included in Compensation, benefits and other personnel on the accompanying Consolidated Statements of Operations. Amortization expense during 2022 includes $1,784 in expense accelerated as a result of the termination of a contractual agreement with a significant client (See Note 17). There were no
Other Assets
Other assets consist of long-term prepaid expenses, deposits and various other assets. Amortization expense for certain other assets for 2024, 2023 and 2022 was $321 , $281 and $262 , respectively.
Accrued Liabilities
Accrued Liabilities on the accompanying Consolidated Balance Sheets consist of:
| 2024 | 2023 | |||||||||||||
| Accrued employee compensation | $ |
|
$ | |||||||||||
| Accrued employee benefits and other personnel |
|
|||||||||||||
| Accrued voluntary separation program |
|
|||||||||||||
| Accrued consulting, outsourcing and professional fees |
|
|||||||||||||
| Accrued sub-advisory, distribution and other asset management fees |
|
|||||||||||||
| Accrued dividend payable |
|
|||||||||||||
| Other accrued liabilities |
|
|||||||||||||
| Accrued liabilities | $ |
|
$ | |||||||||||
Note 4 – Fair Value Measurements
The fair value of the Company’s financial assets and liabilities is determined in accordance with the fair value hierarchy. The fair value of the Company’s Level 1 financial assets consists mainly of investments in open-end and closed-end investment products that are quoted daily. Level 2 financial assets consist of Government National Mortgage Association (GNMA) mortgage-backed securities held by the Company's wholly-owned limited purpose federal thrift subsidiary, SEI Private Trust Company (SPTC), Federal Home Loan Bank (FHLB) and other U.S. government agency short-term notes held by SIDCO. The financial assets held by SIDCO were purchased as part of a cash management program requiring only short term, top-tier investment grade government and corporate securities. The financial assets held by SPTC are debt securities issued by GNMA and are backed by the full faith and credit of the U.S. government. These securities were purchased for the sole purpose of satisfying applicable regulatory requirements and have maturity dates which range from 2027 to 2041.
The valuation of the Company's Level 2 financial assets held by SIDCO and SPTC are based upon securities pricing policies and procedures utilized by third-party pricing vendors. The Company's Level 3 financial liabilities at December 31, 2024 and 2023 consist entirely of the estimated fair value of contingent considerations resulting from business acquisitions (See Note 15). The fair value of the contingent considerations were determined using a Monte-Carlo simulation model. There were no transfers of financial assets between levels within the fair value hierarchy during 2024.
Valuation of GNMA and Other U.S. Government Agency Securities
All of the Company's investments in GNMA, FHLB and other U.S. government agency securities are held in accounts at well-established financial institutions. The Company's selection of a financial institution for the purpose of purchasing securities considered a number of various factors including, but not limited to, securities pricing policies and procedures utilized by that financial institution. Each financial institution utilizes the services of independent pricing vendors. These
67
vendors utilize evaluated and industry accepted pricing models that vary by asset class and incorporate available trade, bid and other market information to determine the fair value of the securities. The market inputs, listed in approximate order of priority, include: benchmark yields, reported trade, broker/dealer quotes, issuer spreads, two-sided markets, benchmark securities, bids, offers and reference data. The Company evaluated the information regarding the pricing methodologies and processes utilized by the independent pricing vendors during the selection process of the financial institution. The Company analyzed this information for the purpose of classifying the securities into the appropriate level within the fair value hierarchy and to ensure that each pricing model for each asset class provided the fair value of those specific securities in accordance with generally accepted accounting principles. The Company continually monitors the price of each security for any unanticipated deviations from the previously quoted price. In the event of any significant unanticipated deviations in a security's price, additional analysis is conducted. The Company's investments in GNMA, FHLB and other U.S. government agency securities have been recorded at the prices provided by the independent pricing vendor without adjustment.
The fair value of certain financial assets and liabilities of the Company was determined using the following inputs:
| At December 31, 2024 | ||||||||||||||||||||||||||||||||
|
Level 1 |
Level 2 |
Level 3 | NAV as a Practical Expedient | Total | ||||||||||||||||||||||||||||
| Assets | ||||||||||||||||||||||||||||||||
| Equity securities | $ | $ | $ | — | $ | — | $ | |||||||||||||||||||||||||
| Available-for-sale debt securities | — | — | ||||||||||||||||||||||||||||||
| Securities owned | — | — | ||||||||||||||||||||||||||||||
| Investment funds sponsored by LSV | — | — | — | |||||||||||||||||||||||||||||
| Total assets measured at fair value | $ | $ | $ | — | $ | $ | ||||||||||||||||||||||||||
| Liabilities | ||||||||||||||||||||||||||||||||
| Contingent considerations | $ | — | $ | — | $ | $ | — | $ | ||||||||||||||||||||||||
| Total liabilities measured at fair value | $ | — | $ | — | $ | $ | — | $ | ||||||||||||||||||||||||
| At December 31, 2023 | ||||||||||||||||||||||||||||||||
|
Level 1 |
Level 2 |
Level 3 | NAV as a Practical Expedient | Total | ||||||||||||||||||||||||||||
| Assets | ||||||||||||||||||||||||||||||||
| Equity securities | $ | $ | $ | — | $ | — | $ | |||||||||||||||||||||||||
| Available-for-sale debt securities | — | — | ||||||||||||||||||||||||||||||
| Securities owned | — | — | ||||||||||||||||||||||||||||||
| Investment funds sponsored by LSV | — | — | — | |||||||||||||||||||||||||||||
| Total assets measured at fair value | $ | $ | $ | — | $ | $ | ||||||||||||||||||||||||||
| Liabilities | ||||||||||||||||||||||||||||||||
| Contingent considerations | $ | — | $ | — | $ | $ | — | $ | ||||||||||||||||||||||||
| Total liabilities measured at fair value | $ | — | $ | — | $ | $ | — | $ | ||||||||||||||||||||||||
Note 5 – Investments and Other Marketable Securities
The Company's investments include available-for-sale debt securities, investments in SEI-sponsored and non-SEI-sponsored investment products, equities, investments in funds sponsored by its unconsolidated affiliate, LSV, and equity method investments, which primarily relates to its investment in LSV (See Note 2). The Company's other marketable securities include securities owned by SIDCO and investments in money market funds and commercial paper.
68
Investments on the accompanying Consolidated Balance Sheets consist of:
| 2024 | 2023 | |||||||||||||
| Available for sale and equity securities | $ |
|
$ | |||||||||||
| Investments in affiliated funds |
|
|||||||||||||
| Equity method investments |
|
|||||||||||||
| Total | $ |
|
$ | |||||||||||
Available For Sale and Equity Securities
Available For Sale and equity securities consist of:
| At December 31, 2024 | ||||||||||||||||||||||||||
| Cost | Gross Unrealized Gains |
Gross Unrealized (Losses) |
Fair Value | |||||||||||||||||||||||
| Available for sale debt securities | $ | $ | $ | ( |
$ | |||||||||||||||||||||
| SEI-sponsored investment products | ||||||||||||||||||||||||||
| Equities and other investment products | ||||||||||||||||||||||||||
| $ | $ | $ | ( |
$ | ||||||||||||||||||||||
| At December 31, 2023 | ||||||||||||||||||||||||||
| Cost | Gross Unrealized Gains |
Gross Unrealized (Losses) |
Fair Value | |||||||||||||||||||||||
| Available for sale debt securities | $ | $ | $ | ( |
$ | |||||||||||||||||||||
| SEI-sponsored investment products | ( |
|||||||||||||||||||||||||
| Equities and other investment products | ||||||||||||||||||||||||||
| $ | $ | $ | ( |
$ | ||||||||||||||||||||||
Net unrealized holding losses at December 31, 2024 of the Company's available-for-sale debt securities were $8,536 (net of income tax benefit of $2,549 ). Net unrealized losses at December 31, 2023 of the Company's available-for-sale debt securities were $6,875 (net of income tax benefit of $2,054 ). These unrealized losses are associated with the Company’s investments in mortgage-backed securities issued by GNMA and were caused by interest rate increases (See Note 4). The contractual cash flows of these securities are guaranteed by an agency of the U.S. government. Accordingly, it is expected that the securities would not be settled at a price less than the amortized cost bases of the Company's investments. The Company does not intend to sell the investments and it is not more likely than not that the Company will be required to sell the investments before recovery of their amortized cost bases. Net unrealized gains and losses are reported as a separate component of Accumulated other comprehensive loss on the accompanying Consolidated Balance Sheets.
The following tables provide the scheduled maturities of the Company's available-for-sale debt securities:
| At December 31, 2024 | ||||||||||||||
| Cost | Fair Value | |||||||||||||
| Within one year | $ | $ | ||||||||||||
| After one year through five years | ||||||||||||||
| After 5 years through 10 years | ||||||||||||||
| After 10 years | ||||||||||||||
| $ | $ | |||||||||||||
| At December 31, 2023 | ||||||||||||||
| Cost | Fair Value | |||||||||||||
| Within one year | $ | $ | ||||||||||||
| After one year through five years | ||||||||||||||
| After 5 years through 10 years | ||||||||||||||
| After 10 years | ||||||||||||||
| $ | $ | |||||||||||||
69
There were gross realized gains of $475 and gross realized losses of $215 and $602 from available-for-sale debt securities during 2024, 2023 and 2022, respectively. Realized gains and losses from available-for-sale debt securities, including amounts reclassified from accumulated comprehensive loss, are reflected in Net gain (loss) from investments on the accompanying Consolidated Statements of Operations.
There were gross realized gains of $2,218 and gross realized losses of $1,550 from investment products and equities during 2024. In 2023, there were gross realized gains of $661 and gross realized losses of $349 from investment products and equities. In 2022, there were gross realized gains of $263 and gross realized losses of $773 from investment products and equities. Gains and losses from investment products and equities are reflected in Net gain (loss) from investments on the accompanying Consolidated Statements of Operations.
Investments in Affiliated Funds
The Company has an investment in funds sponsored by LSV. The Company records this investment at fair value. Unrealized gains and losses from the change in fair value of these funds are recognized in Net gain (loss) from investments on the accompanying Consolidated Statements of Operations.
The funds had a fair value of $8,129 and $7,316 at December 31, 2024 and 2023, respectively. The Company recognized gains of $813 and $950 during 2024 and 2023, respectively, and losses of $550 during 2022 from the change in fair value of the funds.
Securities Owned
The Company’s broker-dealer subsidiary, SIDCO, has investments in U.S. government agency securities with maturity dates less than one year. These investments are reflected as Securities owned on the accompanying Consolidated Balance Sheets. Due to specialized accounting practices applicable to investments by broker-dealers, the securities are reported at fair value and changes in fair value are recorded in current period earnings. The securities had a fair value of $29,583 and $31,334 at December 31, 2024 and 2023, respectively. There were no material net gains or losses from the change in fair value of the securities during 2024, 2023 and 2022.
Cash Equivalents
The Company's investments in money market funds and commercial paper classified as cash equivalents on the accompanying Consolidated Balance Sheets had a fair value of $541,635 and $565,588 at December 31, 2024 and 2023, respectively. There were no material unrealized or realized gains or losses from these investments during 2024 and 2023.
Note 6 – Line of Credit
The Company has a five-year $325,000 Credit Agreement (the Credit Facility) with Wells Fargo Bank, N.A. (Wells Fargo), and a syndicate of other lenders. The Credit Facility is scheduled to expire in April 2026, at which time any aggregate principal amount of loans outstanding becomes payable in full. Any borrowings made under the Credit Facility will accrue interest at rates that, at the Company's option, are based on a base rate (the Base Rate) plus a premium that can range from 0.25 % to 1.00 % or the Adjusted Term Secured Overnight Financing Rate (SOFR) plus a premium that can range from 1.25 % to 2.00 % depending on the Company’s Leverage Ratio (a ratio of consolidated indebtedness to consolidated earnings before interest, taxes, depreciation and amortization (EBITDA) for the four preceding fiscal quarters, all as defined in the related agreement). The Base Rate is defined as the highest of a) the Prime Rate, b) the Federal Funds Rate plus 0.50 % and c) the Adjusted Term SOFR for a one-month tenor in effect on such day plus 1.00 %.
The Company also pays quarterly commitment fees based on the unused portion of the Credit Facility. The quarterly fees for the Credit Facility can range from 0.15 % of the amount of the unused portion to 0.30 %, depending on the Company’s Leverage Ratio. Certain wholly-owned subsidiaries of the Company have guaranteed the obligations of the Company under the agreement. The aggregate amount of the Credit Facility may be increased by an additional $100,000 under certain conditions set forth in the agreement. The Company may issue up to $15,000 in letters of credit under the terms of the Credit Facility. The Company pays a periodic commission fee of 1.25 % plus an issuance fee of 0.20 % of the aggregate face amount of the outstanding letters of credit issued under the Credit Facility.
The Credit Facility contains covenants with restrictions on the ability of the Company to do transactions with affiliates other than wholly-owned subsidiaries or to incur liens or certain types of indebtedness as defined in the agreement. In the event of a default under the Credit Facility, the Company would also be restricted from paying dividends on, or repurchasing, its common stock without the approval of the lenders. Upon the occurrence of certain financial or economic events, significant corporate events, or certain other events of default constituting an event of default under the Credit Facility, all loans outstanding may be declared immediately due and payable and all commitments under the agreement may be terminated.
The Company had no borrowings related to the Credit Facility as of December 31, 2024.
70
As of December 31, 2024, the Company had outstanding letters of credit of $4,866 under the Credit Facility. These letters of credit are scheduled to expire during 2025. The amount of the Credit Facility available for general corporate purposes as of January 31, 2025 was $320,134 . The Company was in compliance with all covenants of the Credit Facility during 2024.
The Company incurred $563 , $583 and $749 in interest charges and commitment fees relating to the Credit Facility during 2024, 2023 and 2022, respectively, which are reflected in Interest expense on the accompanying Consolidated Statements of Operations.
Note 7 – Shareholders’ Equity
Stock-Based Compensation
On April 2, 2024, the Company’s Board of Directors approved the 2024 Omnibus Equity Compensation Plan (the 2024 Plan), which was later approved by the shareholders of the Company on May 29, 2024. The 2024 Plan became effective upon receipt of the shareholders' approval on May 29, 2024 and is the successor equity compensation plan to the 2014 Equity Compensation Plan (the 2014 Plan) which was merged with and into the 2024 Plan. The 2024 Plan provides for the grant of stock options, stock units, stock awards, stock appreciation rights and other stock-based awards. No further grants will be made under the 2014 Plan, and shares with respect to all grants outstanding under the 2014 Plan will be issued or transferred under the 2024 Plan. Permitted grantees under the 2024 Plan include employees, non-employee directors and consultants who perform services for the Company. The plan is administered by the Compensation Committee of the Board of Directors of the Company. As of December 31, 2024, the Company has restricted stock units and non-qualified stock options outstanding under the 2024 Plan. As of December 31, 2024, a total of 13,602,000 shares of common stock remain available for issuance under the 2024 Plan for future grants.
The Company recognized stock-based compensation expense in its Consolidated Financial Statements in 2024, 2023 and 2022 as follows:
| 2024 | 2023 | 2022 | ||||||||||||||||||
| Stock-based compensation expense | $ |
|
$ | $ | ||||||||||||||||
| Less: Deferred tax benefit | ( |
( |
( |
|||||||||||||||||
| Stock-based compensation expense, net of tax | $ |
|
$ | $ | ||||||||||||||||
Stock Options
All outstanding stock options have performance-based vesting provisions that tie the vesting of stock options to the Company’s financial performance which are established at the time of grant, as well as a service condition which requires a minimum waiting period from the date of grant. The performance targets are measured annually on December 31. The amount of stock-based compensation expense recognized in the period is based upon management’s estimate of when the financial vesting targets may be achieved. Any change in management’s estimate could result in the remaining amount of stock-based compensation expense to be accelerated, spread out over a longer period, or reversed. This may cause volatility in the recognition of stock-based compensation expense in future periods and could materially affect the Company’s earnings.
The Company uses the Black-Scholes option pricing model to determine the fair value of stock options. The determination of the fair value of stock options on the date of grant using an option-pricing model is affected by the price of the Company’s common stock as well as other variables. These variables include expected stock price volatility over the term of the awards, actual and projected employee stock exercise behaviors, risk-free interest rate and expected dividends. The Company primarily uses historical data to estimate the variables used in the option-pricing model except expected volatility. The Company uses a combination of historical and implied volatility.
The weighted average fair value of the Company’s stock options granted during 2024, 2023 and 2022 were $23.07 , $15.70 and $17.95 , respectively, using the following assumptions:
| 2024 | 2023 | 2022 | ||||||||||||||||||
| Expected term (in years) | ||||||||||||||||||||
| Expected volatility |
|
% | % | % | ||||||||||||||||
| Expected dividend yield |
|
% | % | % | ||||||||||||||||
| Risk-free interest rate |
|
% | % | % | ||||||||||||||||
The Company reviews its estimates of when vesting targets will be achieved based upon financial performance on an annual basis. The Company revised its estimates during 2024 which resulted in an increase of $11,181 in stock-based compensation in comparison to the previous management estimate. The change in management’s estimate during 2023
71
resulted in a decrease of $6,941 and the change in estimate in 2022 resulted in a decrease of $4,915 in stock-based compensation expense in comparison to the previous management estimates.
As of December 31, 2024, there was approximately 6,755,000 unvested employee stock options with an unrecognized compensation cost of $67,910 that the Company expects will vest and be expensed through 2027 with a weighted average period of 2.1 years.
This table presents certain information relating to the Company’s stock option plans for 2024, 2023 and 2022:
| Number of Shares |
Weighted Average Price |
|||||||||||||
| Balance as of December 31, 2021 | $ | |||||||||||||
| Granted | ||||||||||||||
| Exercised | ( |
|||||||||||||
| Expired or canceled | ( |
|||||||||||||
| Balance as of December 31, 2022 | $ | |||||||||||||
| Granted | ||||||||||||||
| Exercised | ( |
|||||||||||||
| Expired or canceled | ( |
|||||||||||||
| Balance as of December 31, 2023 | $ | |||||||||||||
| Granted | ||||||||||||||
| Exercised | ( |
|||||||||||||
| Expired or canceled | ( |
|||||||||||||
| Balance as of December 31, 2024 | $ | |||||||||||||
| Exercisable as of December 31, 2024 | $ | |||||||||||||
The expiration dates for options outstanding at December 31, 2024 range from December 8, 2025 to December 12, 2034 with a weighted average remaining contractual life of 6.2 years.
Upon exercise of stock options, the Company will issue new shares of its common shares. The Company does not hold any shares in treasury. The total intrinsic value of options exercised during 2024 and 2023 was $54,101 and $34,499 , respectively. The total options exercisable as of December 31, 2024 had an intrinsic value of $203,313 . The total options outstanding as of December 31, 2024 had an intrinsic value of $324,138 . The total intrinsic value for options outstanding and options exercisable is calculated as the difference between the market value of the Company’s common stock and the exercise price of the shares. The market value of the Company’s common stock as of December 31, 2024 was $82.48 as reported by the Nasdaq Stock Market, LLC.
Restricted Stock Units
The Company's restricted stock units (RSUs) are equivalent to one share of the Company's common stock. These equity awards are time-based and are not based on the achievement of performance targets. RSUs accrue dividends based on dividends paid on the Company's common stock and are paid in cash upon satisfaction of the vesting requirements related to the underlying RSU. The majority of the Company's RSUs will vest on the third anniversary of the issuance date.
72
This table presents certain information relating to the Company’s RSUs for 2024, 2023 and 2022:
| Number of RSUs |
Weighted Average Grant-Date Fair Value |
|||||||||||||
| Balance as of December 31, 2021 | $ | |||||||||||||
| Granted | ||||||||||||||
| Vested | ||||||||||||||
| Expired or canceled | ||||||||||||||
| Balance as of December 31, 2022 | $ | |||||||||||||
| Granted | ||||||||||||||
| Vested | ( |
|||||||||||||
| Expired or canceled | ( |
|||||||||||||
| Balance as of December 31, 2023 | $ | |||||||||||||
| Granted | ||||||||||||||
| Vested | ( |
|||||||||||||
| Expired or canceled | ( |
|||||||||||||
| Balance as of December 31, 2024 | $ | |||||||||||||
As of December 31, 2024, the unrecognized compensation cost associated with the Company's RSUs was $52,685 , which will be expensed through 2027 over a weighed average remaining period of 1.9 years.
Employee Stock Purchase Plan
The Company has an employee stock purchase plan that provides for offerings of common stock to eligible employees at a price equal to 85 percent of the fair market value of the stock at the end of the stock purchase period, as defined. The Company has reserved 15,652,000 shares for issuance under this plan. At December 31, 2024, 12,558,000 cumulative shares have been issued. There were no
Common Stock Buyback
The Board of Directors, under multiple authorizations, has authorized the purchase of the Company’s common stock on the open market or through private transactions. As of December 31, 2024, the Company had approximately $169,600 of authorization remaining for the purchase of common stock. The following table provides the total number of shares repurchased and the related total costs in 2024, 2023 and 2022:
| Year | Total Number of Shares Repurchased |
Total Cost | ||||||||||||
| 2024 |
|
$ |
|
|||||||||||
| 2023 | ||||||||||||||
| 2022 | ||||||||||||||
The cost of stock purchases during the annual period includes the cost of excise taxes applicable to stock repurchases and certain transactions that settled in the following year. The Company immediately retires its common stock when purchased. Upon retirement, the Company reduces Capital in excess of par value for the average capital per share outstanding and the remainder is charged against Retained earnings. If the Company reduces its Retained earnings to zero, any subsequent purchases of common stock will be charged entirely to Capital in excess of par value.
Cash Dividends
On May 29, 2024, the Board of Directors declared a cash dividend of $0.46 per share on the Company’s common stock, which was paid on June 18, 2024, to shareholders of record on June 10, 2024. On December 12, 2024, the Board of Directors declared a cash dividend of $0.49 per share on the Company’s common stock, which was paid on January 8, 2025, to shareholders of record on December 27, 2024.
The cash dividends declared in 2024, 2023 and 2022 were $123,119 , $117,894 and $112,429 , respectively. The Board of Directors has indicated its intention to declare future cash dividends on a semiannual basis.
73
Note 8 – Accumulated Other Comprehensive Income (Loss)
|
Foreign
Currency
Translation
Adjustments
|
Unrealized Holding Gains (Losses) on Investments |
Accumulated Other Comprehensive Income (Loss) |
||||||||||||||||||
| Balance, January 1, 2022 | $ | ( |
$ | ( |
$ | ( |
||||||||||||||
| Other comprehensive loss before reclassifications | ( |
( |
( |
|||||||||||||||||
| Amounts reclassified from accumulated other comprehensive loss | ||||||||||||||||||||
| Net current-period other comprehensive loss | ( |
( |
( |
|||||||||||||||||
| Balance, December 31, 2022 | $ | ( |
$ | ( |
$ | ( |
||||||||||||||
| Other comprehensive income before reclassifications | ||||||||||||||||||||
| Amounts reclassified from accumulated other comprehensive loss | ||||||||||||||||||||
| Net current-period other comprehensive income | ||||||||||||||||||||
| Balance, December 31, 2023 | $ | ( |
$ | ( |
$ | ( |
||||||||||||||
| Other comprehensive loss before reclassifications | ( |
( |
( |
|||||||||||||||||
| Amounts reclassified from accumulated other comprehensive loss | ( |
( |
||||||||||||||||||
| Net current-period other comprehensive loss | ( |
( |
( |
|||||||||||||||||
| Balance, December 31, 2024 | $ | ( |
$ | ( |
$ | ( |
||||||||||||||
Note 9 – Employee Benefit Plan
The Company has a tax-qualified defined contribution plan (the Plan). The Plan provides retirement benefits, including provisions for early retirement and disability benefits, as well as a tax-deferred savings feature. After satisfying certain requirements, participants are vested in employer contributions at the time the contributions are made. All Company contributions are discretionary and are made from available profits. The Company contributed $19,038 , $18,069 and $16,859 to the Plan in 2024, 2023 and 2022, respectively.
Note 10 – Commitments and Contingencies
The Company leases software, facilities, and equipment under non-cancelable operating leases, some which contain escalation clauses for increased taxes and operating expenses. The Company has entered into maintenance agreements primarily for its equipment. Rent expense, primarily related to user licenses for software, was $81,142 , $71,962 and $65,792 in 2024, 2023 and 2022, respectively.
The aggregate noncancellable minimum commitments at December 31, 2024 are:
| Year | Aggregate Noncancellable Minimum Commitments | ||||
| 2025 | $ | ||||
| 2026 | |||||
| 2027 | |||||
| 2028 | |||||
| 2029 and thereafter | |||||
| $ | |||||
74
In the ordinary course of business, the Company from time to time enters into contracts containing indemnification obligations of the Company. These obligations may require the Company to make payments to another party upon the occurrence of certain events including the failure by the Company to meet its performance obligations under the contract. These contractual indemnification provisions are often standard contractual terms of the nature customarily found in the type of contracts entered into by the Company. In many cases, there are no stated or notional amounts included in the indemnification provisions. There are no amounts reflected on the Consolidated Balance Sheets as of December 31, 2024 and 2023 related to these indemnifications.
Rubicon Wealth Management
Prior to the relationship termination described in the following sentence, SEI Private Trust Company (SPTC), a wholly-owned operating subsidiary of SEI, held custody accounts for the end-clients of Rubicon Wealth Management LLC, an SPTC investment advisor client (Rubicon). On May 1, 2024, SPTC terminated its client relationship with Rubicon in light of the events associated with the Allegation (as defined below), and notified Rubicon clients with accounts at SPTC that they were required to transfer their accounts to other custodians.
Beginning on July 10, 2024, nine of Rubicon’s clients that had custodial accounts at SPTC filed state civil actions for fraud in the Court of Common Pleas of Montgomery County, Pennsylvania against Rubicon, its founder, Scott Mason, Mr. Mason’s wife, Lynne Mason, and Orchard Park Real Estate Holdings LLC (Orchard Park), a business owned by the Masons. The fraud allegation (the Allegation) is based on the claim that Mr. Mason used Rubicon client funds to invest in Orchard Park, an entity allegedly formed and controlled by Mr. Mason, and that all such invested funds were subsequently withdrawn from Orchard Park by the Masons and were used for their own, extensive personal expenses. The Company is also aware of at least two other cases filed in other jurisdictions against Rubicon and/or the Masons and Orchard Park, and there may be additional cases filed against Rubicon and/or the Masons of which the Company is unaware. On January 17, 2025, the SEC charged Mason, Rubicon, and Orchard Park with violating Section 10(b) of the Securities Exchange Act of 1934 and Rule 10b-5 thereunder, and Mason and Rubicon with violating Sections 206(1) and (2) of the Investment Advisers Act of 1940 in connection with the Allegations, and the U.S. Attorney’s Office for the Eastern District of Pennsylvania announced criminal charges against Mason. Mason, Rubicon and Orchard Park have consented to the entry of final judgments in the SEC matter, subject to court approval. On January 28, 2025, Mason pled guilty to nine criminal charges, including wire fraud, securities fraud, investment advisor fraud and filing false tax returns.
As of February 11, 2025, eight separate, but related, suits have been filed against SPTC in its capacity as custodian for the Rubicon accounts of the plaintiffs. These actions were also filed in the Court of Common Pleas of Montgomery County, Pennsylvania and are: Star Sitron vs. SEI Private Trust Company, Case No. 2024-17132 (Sitron); Charles Murray vs. SEI Private Trust Company, Case No. 2024-18391 (Murray); James A. Byrne & Sharon Byrne vs. SEI Private Trust Company, Case No. 2024-20612; Melody Pettinelli & Melody Pettinelli as Trustee of the Donald Pettinelli Trust dated 11/7/1996 vs. SEI Private Trust Company, Case. 2024-21377; Norman Love vs. SEI Private Trust Company, Case No. 2024-21361; Stephen Red & Carla Red vs. SEI Private Trust Company, Case No. 2024-21902; Edward A. Tettemer & Lyn K. Tettemer vs. SEI Private Trust Company, Case No. 2024-21827; and Jonathan Klein & Sara Klein vs. SEI Private Trust Company, Case No. 2024- 23294 (collectively, the Rubicon Actions). Based on the complaints that have thus far been filed in the Rubicon Actions, these actions appear to be based generally on similar theories that include alleged breach of contract, breach of fiduciary duty, negligence, and breach of state consumer protection laws by SPTC in connection with certain transfers of Plaintiffs’ assets from SPTC custodial accounts to Orchard Park bank accounts. SPTC has been served with complaints in two of the Rubicon Actions, Sitron and Murray. In the remaining six Rubicon Actions, the plaintiffs have commenced suit but have not filed their formal complaints. The Sitron and Murray cases are both in the early stages, with initial motion practice and discovery now occurring.
On August 8, 2024, SPTC filed preliminary objections to the plaintiff’s complaint in Sitron, which remain pending. On September 12, 2024 the Sitron court issued an initial case management order requiring, among other things, fact discovery to be completed within approximately 18 months and dispositive motions to be filed within 21 months from the commencement of the action. On October 7, 2024, the Murray court issued an initial case management order requiring, among other things, fact discovery to be completed within 9 months and dispositive motions to be filed within 12 months of commencement of the action. On October 16, 2024, SPTC filed preliminary objections to the plaintiff's claims in Murray. On December 13, 2024, the Murray court denied each of SPTC’s preliminary objections. On January 16, 2025, SPTC filed its Answer with New Matter to the Murray complaint and on February 5, 2025, SPTC joined Rubicon, Mason and Orchard Park as additional defendants in the Murray litigation.
While the Rubicon Actions are in their infancy and the ultimate outcomes of these litigations remain uncertain, SEI and SPTC intend to defend each of the Rubicon Actions. Currently, SPTC estimates that the aggregate amount of Rubicon client assets transferred at the direction of Mr. Mason from SPTC custodial accounts to Orchard Park bank accounts is approximately $15,000 . In the event that SPTC is unsuccessful in its defense of the Rubicon Actions, SEI does not
75
currently believe that the losses associated with such unsuccessful defense would exceed the approximately $15,000 of Rubicon client assets that Mr. Mason directed to be transferred to Orchard Park.
United Kingdom Financial Conduct Authority Supervisory Review of SEI Investments (Europe) Limited
On July 31, 2024, SEI Investments (Europe) Limited (SIEL), an indirectly, wholly-owned operating subsidiary of SEI, received a final requirement notice from the Financial Conduct Authority of the United Kingdom (the FCA) under section 166(3)(a) of the Financial Services and Markets Act 2000 (FSMA), requiring SIEL to engage a “Skilled Person” to undertake a two-stage review of SIEL’s governance arrangements and control environment. In the first stage, the Skilled Person will provide SIEL and the FCA with a report setting out the Skilled Person’s view of the effectiveness of the control environment and governance arrangements with respect to key risks, as well as the Skilled Person’s recommendations where necessary to address any identified weaknesses (the Section 166 Report). In the second stage, the Skilled Person will provide an independent view of the quality and completeness of the remediation carried out by SIEL to address any findings from the initial stage and any self-identified weaknesses, including a view on SIEL’s compliance with relevant regulations. The appointment of a Skilled Person is one of the regulatory tools used by the FCA to supervise and monitor firms it regulates. A Skilled Person is an independent third-party expert with the relevant knowledge and experience to undertake a review as described above. The FCA may use the Section 166 Report and any associated information or documents provided by the Skilled Person in connection with the exercise of any of its statutory functions including its supervisory and enforcement powers.
In August 2024, SIEL, with the approval of the FCA, appointed the firm of Grant Thornton to act as the Skilled Person.
On December 16, 2024, Grant Thornton delivered the first stage of its Skilled Person Report in which it concluded, in summary, that SIEL has an established corporate governance framework and risk management framework that it considered to be appropriate in design for the relative size and complexity of its activities. The Skilled Person Report did however make a number of recommendations for improvements in its governance arrangements with its U.S. parent, its three lines of defense, resourcing of its control functions, strategy and culture.
Following the provision of the first stage of the Skilled Person Report, SIEL continues to engage with the FCA as part of the exercise of its ongoing supervisory remit. This engagement is focused on determining the remediation actions that SIEL expects to be required, the parameters of the Skilled Person’s Stage 2 review and the potential requirement that SIEL obtain FCA consent to certain arrangements and/or new products or services while SIEL carries out the remediation activities.
SIEL is committed to implementing the necessary measures to meet the regulator’s expectations for a firm of its size and complexity that will enable SIEL to continue driving the growth of its U.K. business effectively. Until the matters currently under review with the FCA are finalized, neither SIEL nor SEI is reasonably able to provide an estimate of the costs or consequences that may be associated with any supervisory actions or the remediation activities in which SIEL is engaging.
Other Matters
The Company and certain of its subsidiaries are party to various other examinations, investigations, actions and claims arising in the normal course of business that the Company does not believe are material. The Company believes that the ultimate resolution of these matters will not have a material adverse effect on the Company's financial position or the manner in which the Company conducts its business. Currently, the Company does not believe the amount of losses associated with these matters can be estimated. While the Company does not believe that the amount of such losses will, when liquidated or estimable, be material to its financial position, the assumptions may be incorrect and any such loss could have a material adverse effect on the Company's results of operations or the manner in which the Company conducts its business in the period(s) during which the underlying matters are resolved.
76
Note 11 – Income Taxes
The federal and state and foreign income tax provision is summarized as follows:
| Year Ended December 31, | 2024 | 2023 | 2022 | |||||||||||||||||
| Current | ||||||||||||||||||||
| Federal | $ |
|
$ | $ | ||||||||||||||||
| State |
|
|||||||||||||||||||
| Foreign |
|
|||||||||||||||||||
|
|
||||||||||||||||||||
| Deferred | ||||||||||||||||||||
| Federal | ( |
( |
( |
|||||||||||||||||
| State | ( |
( |
( |
|||||||||||||||||
| Foreign | ( |
( |
( |
|||||||||||||||||
| ( |
( |
( |
||||||||||||||||||
| Total income taxes | $ |
|
$ | $ | ||||||||||||||||
Annual tax provisions include amounts considered sufficient to pay assessments that may result from examination of prior year tax returns; however, the amount ultimately paid upon resolution of issues raised may differ materially from the amount accrued. The examination and the resolution process may last longer than one year.
The components of Income before income taxes are summarized as follows:
| Year Ended December 31, | 2024 | 2023 | 2022 | |||||||||||||||||
| Domestic | $ |
|
$ | $ | ||||||||||||||||
| Foreign |
|
|||||||||||||||||||
| $ |
|
$ | $ | |||||||||||||||||
The Company's foreign income is primarily earned in Canada, the Republic of Ireland, Luxembourg and the United Kingdom.
The effective income tax rate differs from the federal income tax statutory rate due to the following:
| Year Ended December 31, | 2024 | 2023 | 2022 | ||||||||||||||
| Statutory rate |
|
% | % | % | |||||||||||||
| State taxes, net of federal tax benefit |
|
||||||||||||||||
| Foreign tax expense and tax rate differential |
|
( |
( |
||||||||||||||
| Tax benefit from stock option exercises | ( |
( |
( |
||||||||||||||
| Research and development tax credit | ( |
( |
( |
||||||||||||||
| Foreign-Derived Intangible Income Deduction (FDII) | ( |
( |
( |
||||||||||||||
| Other, net |
|
||||||||||||||||
|
|
% | % | % | ||||||||||||||
77
Deferred income taxes for 2024 and 2023 reflect the impact of temporary differences between the amount of assets and liabilities for financial reporting purposes and such amounts as measured by tax laws and regulations. Significant components of deferred tax assets and liabilities at December 31, 2024 and 2023 are as follows:
| 2024 | 2023 | |||||||||||||
| Deferred Tax Assets: | ||||||||||||||
| Stock-based compensation expense | $ |
|
$ | |||||||||||
| Federal net operating loss and R&D credit carryforward |
|
|||||||||||||
| State net operating loss carryforward |
|
|||||||||||||
| Foreign net operating loss carryforward and other |
|
|||||||||||||
| Capitalized research and development |
|
|||||||||||||
| Accrued expense associated with voluntary separation program |
|
|||||||||||||
| Basis differences in investments |
|
|||||||||||||
| Federal benefit of state tax deduction for uncertain tax positions |
|
|||||||||||||
| Revenue and expense recognized in different periods for financial reporting and income tax purposes |
|
|||||||||||||
Other assets |
|
|||||||||||||
| Total deferred income tax assets |
|
|||||||||||||
| Less: Federal net operating loss and R&D valuation allowance | ( |
( |
||||||||||||
| Less: State net operating loss valuation allowance | ( |
( |
||||||||||||
| Less: Foreign net operating loss valuation allowance | ( |
( |
||||||||||||
| Net deferred income tax assets | $ |
|
$ | |||||||||||
| Deferred Tax Liabilities: | ||||||||||||||
| Difference in financial reporting and income tax depreciation methods | $ | ( |
$ | ( |
||||||||||
| Difference between book and tax basis of other assets | ( |
( |
||||||||||||
| Goodwill and other intangibles | ( |
( |
||||||||||||
| Capitalized contract costs | ( |
( |
||||||||||||
| Total deferred income tax liabilities | $ | ( |
$ | ( |
||||||||||
| Net deferred income tax assets | $ |
|
$ | |||||||||||
The 2017 Tax Cut Job Act (Tax Act) enacted in December 2017 contained a provision which became effective for research and development expenditures incurred by the Company on or after January 1, 2022. Under the Tax Act, research and development costs incurred are no longer allowed as an immediate deduction for federal income tax purposes. Rather, these expenditures incurred must be capitalized and amortized over a five-year period for activities conducted in the United States or 15 years for activities conducted abroad. The Company recorded a deferred tax asset of $73,944 as of December 31, 2024 associated with this provision of the Tax Act which reduced the Company's net deferred tax liabilities related to capitalized research and development expenditures.
As of December 31, 2024, the Company has federal operating loss carryovers of $14,699 remaining from the acquisition of Novus Partners as well as research and development credit carryovers remaining of $1,302 . The Company has recorded a deferred tax asset associated with these carryovers of $4,388 and a related valuation allowance of $794 associated with the statutory limitations of the carryforwards. Operating loss carryovers generated after December 31, 2017 have an indefinite carryforward period, while those generated before December 31, 2017 will expire beginning in 2033 through 2037.
The valuation allowances against deferred tax assets at December 31, 2024 and 2023 are related to federal and state net operating losses from certain domestic subsidiaries, foreign net operating losses from certain foreign subsidiaries and the restriction of the use of the foreign tax credits. Internal Revenue Code Section 382 places an annual limitation on the amount of operating losses and tax credits an acquiring entity can use of operating loss and tax credit carryforwards of acquired entities. Certain state and foreign tax statutes significantly limit the utilization of net operating losses for domestic and foreign subsidiaries. Furthermore, these net operating losses cannot be used to offset the net income of other subsidiaries.
The Company recognizes uncertain tax positions in accordance with the applicable accounting guidance and adjusts these liabilities when management’s judgment changes as a result of the evaluation of new information not previously
78
The Company files a consolidated federal income tax return and separate income tax returns with various states. Certain subsidiaries of the Company file tax returns in foreign jurisdictions. The Company is no longer subject to U.S. federal income tax examination for years before 2021 and is no longer subject to state, local or foreign income tax examinations by authorities for years before 2018.
A reconciliation of the beginning and ending amount of unrecognized tax benefit is as follows:
| 2024 | 2023 | 2022 | ||||||||||||||||||
| Balance as of January 1 | $ |
|
$ | $ | ||||||||||||||||
| Tax positions related to current year: | ||||||||||||||||||||
| Gross additions |
|
|||||||||||||||||||
| Tax positions related to prior years: | ||||||||||||||||||||
| Gross additions |
|
|||||||||||||||||||
| Settlements | ( |
|||||||||||||||||||
| Lapses on statute of limitations | ( |
( |
( |
|||||||||||||||||
| Balance as of December 31 | $ |
|
$ | $ | ||||||||||||||||
The above reconciliation of the gross unrecognized tax benefit will differ from the amount which would affect the effective tax rate because of the recognition of the federal and state tax benefits and interest and penalties.
The Company classifies all interest and penalties as income tax expense. The Company has recorded $1,725 , $1,385 and $1,118 in liabilities for tax-related interest and penalties in 2024, 2023 and 2022, respectively.
The Company estimates it will recognize $4,377 of unrecognized tax benefits within the next twelve months due to lapses on the statute of limitation.
The Company includes its direct and indirect subsidiaries in its U.S. consolidated federal income tax return. The Company’s tax sharing allocation agreement provides that any subsidiary having taxable income will pay a tax liability equivalent to what that subsidiary would have paid if it filed a separate income tax return. If the separately calculated federal income tax provision for any subsidiary results in a tax loss, the current benefit resulting from such loss, to the extent utilizable on a separate return basis, is accrued and paid to that subsidiary.
Note 12 – Business Segment Information
The Company's business segments are generally organized around its target markets. The Company’s reportable business segments are:
Investment Managers – Provides an outsourced investment management operating platform to alternative and traditional asset managers, fund companies, and sovereign wealth funds;
Private Banks – Provides outsourced investment processing and investment management platforms to banks and trust institutions, independent wealth advisers, and financial advisors worldwide;
Investment Advisors – Provides investment management and investment processing platforms to affluent investors through a network of independent registered investment advisors, financial planners, and other investment professionals in the United States;
Institutional Investors – Provides Outsourced Chief Investment Officer solutions, including investment management and administrative outsourcing platforms to retirement plan sponsors, healthcare systems, higher education and other not-for-profit organizations worldwide; and
Investments in New Businesses – Focuses on providing investment management solutions to ultra-high-net-worth families residing in the United States; hosted technology services to family offices and financial institutions; developing network and data protection services; entering new markets; and conducting other research and development activities.
79
The Company's CODM is the chief executive officer who uses the reported measures of each business segment's profit or loss to allocate resources and assess performance by comparing historical, actual and forecasted amounts. The Company's CODM does not evaluate business segments using asset information.
During the first quarter 2024 and made effective January 1, 2024, the Company made a determination to reorganize some of its business segments based on how its current CODM manages its businesses. As a result, one of the Company's client relationships formerly reported in the Private Banks segment will be reported in the Investment Managers segment and the Company’s family office services business, formerly reported in the Investment Managers segment, will be reported in the Investments in New Businesses segment. The business segment financial presentation was reclassified in 2024 to conform to this reorganization. Prior year amounts have been reclassified to conform to current year presentation.
In 2024, 2023 and 2022, no single customer accounted for more than 10% of revenues in any business segment.
The following tables highlight certain financial information about each of the Company’s business segments for the years ended December 31, 2024, 2023 and 2022:
| Investment Managers |
Private
Banks
|
Investment Advisors |
Institutional Investors |
Investments in New Businesses |
Total | |||||||||||||||||||||||||||||||||
| For the Year Ended December 31, 2024 | ||||||||||||||||||||||||||||||||||||||
| Total revenue | $ | $ | $ | $ | $ | $ | ||||||||||||||||||||||||||||||||
| Less: | ||||||||||||||||||||||||||||||||||||||
| Operations & services | ||||||||||||||||||||||||||||||||||||||
| Sales, marketing & client service | ||||||||||||||||||||||||||||||||||||||
| Technology services & infrastructure | ||||||||||||||||||||||||||||||||||||||
| Strategic initiatives & new business development | ||||||||||||||||||||||||||||||||||||||
| Other segment expenses (1) | ||||||||||||||||||||||||||||||||||||||
| Segment profit (loss) | $ | $ | $ | $ | $ | ( |
$ | |||||||||||||||||||||||||||||||
| Investment Managers |
Private Banks |
Investment Advisors |
Institutional Investors |
Investments in New Businesses |
Total | |||||||||||||||||||||||||||||||||
| For the Year Ended December 31, 2023 | ||||||||||||||||||||||||||||||||||||||
| Total revenue | $ | $ | $ | $ | $ | $ | ||||||||||||||||||||||||||||||||
| Less: | ||||||||||||||||||||||||||||||||||||||
| Operations & services | ||||||||||||||||||||||||||||||||||||||
| Sales, marketing & client service | ||||||||||||||||||||||||||||||||||||||
| Technology services & infrastructure | ||||||||||||||||||||||||||||||||||||||
| Strategic initiatives & new business development | ||||||||||||||||||||||||||||||||||||||
| Other segment expenses (1) | ||||||||||||||||||||||||||||||||||||||
| Segment profit (loss) | $ | $ | $ | $ | $ | ( |
$ | |||||||||||||||||||||||||||||||
80
| Investment Managers |
Private Banks |
Investment Advisors |
Institutional Investors |
Investments in New Businesses |
Total | |||||||||||||||||||||||||||||||||
| For the Year Ended December 31, 2022 | ||||||||||||||||||||||||||||||||||||||
| Total revenue | $ | $ | $ | $ | $ | $ | ||||||||||||||||||||||||||||||||
| Less: | ||||||||||||||||||||||||||||||||||||||
| Operations & services | ||||||||||||||||||||||||||||||||||||||
| Sales, marketing & client service | ||||||||||||||||||||||||||||||||||||||
| Technology services & infrastructure | ||||||||||||||||||||||||||||||||||||||
| Strategic initiatives & new business development | ||||||||||||||||||||||||||||||||||||||
| Other segment expenses (1) | ||||||||||||||||||||||||||||||||||||||
| Segment profit (loss) | $ | $ | $ | $ | $ | ( |
$ | |||||||||||||||||||||||||||||||
(1) Other segment expenses for each reportable segment includes professional services, occupancy and certain overhead expenses.
A reconciliation of the total segment profit to income from operations on the Consolidated Statements of Operations for the years ended December 31, 2024, 2023 and 2022 is as follows:
| Year Ended December 31, | 2024 | 2023 | 2022 | |||||||||||||||||
| Total segment profit | $ |
|
$ | $ | ||||||||||||||||
Corporate overhead expenses (2)
|
( |
( |
( |
|||||||||||||||||
| Income from operations |
|
|||||||||||||||||||
Other income and expense items to reconcile income from operations to income before income taxes on the Consolidated Statements of Operations include net gain (loss) from investments, interest and dividend income, interest expense, other income and equity in the earnings of unconsolidated affiliates. These items are not allocated to the Company's segments.
The following tables provide additional information for the years ended December 31, 2024, 2023 and 2022 pertaining to the Company's business segments:
| Capital Expenditures (3) | Depreciation | |||||||||||||||||||||||||||||||||||||
| Year Ended December 31, | 2024 | 2023 | 2022 | 2024 | 2023 | 2022 | ||||||||||||||||||||||||||||||||
| Investment Managers | $ |
|
$ | $ | $ |
|
$ | $ | ||||||||||||||||||||||||||||||
| Private Banks |
|
|
||||||||||||||||||||||||||||||||||||
| Investment Advisors |
|
|
||||||||||||||||||||||||||||||||||||
| Institutional Investors |
|
|
||||||||||||||||||||||||||||||||||||
| Investments in New Businesses |
|
|
||||||||||||||||||||||||||||||||||||
| Total from business segments | $ |
|
$ | $ | $ |
|
$ | $ | ||||||||||||||||||||||||||||||
| Corporate Overhead |
|
|
||||||||||||||||||||||||||||||||||||
| $ |
|
$ | $ | $ |
|
$ | $ | |||||||||||||||||||||||||||||||
(3) Capital expenditures include additions to property and equipment and capitalized software.
| Amortization | ||||||||||||||||||||
| Year Ended December 31, | 2024 | 2023 | 2022 | |||||||||||||||||
| Investment Managers | $ |
|
$ | $ | ||||||||||||||||
| Private Banks |
|
|||||||||||||||||||
| Investment Advisors |
|
|||||||||||||||||||
| Institutional Investors |
|
|||||||||||||||||||
| Investments in New Businesses |
|
|||||||||||||||||||
| Total from business segments | $ |
|
$ | $ | ||||||||||||||||
| Corporate Overhead |
|
|||||||||||||||||||
| $ |
|
$ | $ | |||||||||||||||||
81
The following table presents revenues based on the location of the use of the products or services:
| For the Year Ended December 31, | 2024 | 2023 | 2022 | |||||||||||||||||
| United States | $ |
|
$ | $ | ||||||||||||||||
| International operations |
|
|||||||||||||||||||
| $ |
|
$ | $ | |||||||||||||||||
The following table presents assets based on their location:
| 2024 | 2023 | |||||||||||||
| United States | $ |
|
$ | |||||||||||
| International operations |
|
|||||||||||||
| $ |
|
$ | ||||||||||||
Note 13 – Related Party Transactions
The Company, either by itself or through its wholly-owned subsidiaries, serves as the sponsor, administrator, investment advisor, distributor and shareholder servicer for SEI-sponsored investment products. These investment products are offered to clients of the Company and its subsidiaries. Fees earned by the Company for the related services are recognized pursuant to the provisions of investment advisory, fund administration, distribution, and shareholder services agreements directly with the investment products. These fees totaled $389,476 , $389,219 and $420,206 in 2024, 2023 and 2022, respectively. The Company's broker-dealer subsidiary, SIDCO, serves as an introducing broker-dealer for securities transactions of SEI-sponsored investment products. The Company recognized $1,815 , $1,352 and $2,601 in commissions during 2024, 2023 and 2022, respectively. Both of these fees are reflected in Asset management, administration and distribution fees on the accompanying Consolidated Statements of Operations.
Receivables from investment products on the accompanying Consolidated Balance Sheets primarily represent fees receivable for distribution, investment advisory, and administration services to various investment products sponsored by SEI.
Note 14 – Voluntary Separation Program
The Company initiated a Voluntary Separation Program (VSP) to long-tenured employees which was finalized in July 2022. The VSP was offered to long-tenured employees as part of its commitment to professional development and expanded responsibilities for current and new employees by increasing advancement opportunities.
The VSP was made available to employees in the United States who met the long-term tenure requirements and included a severance package and the continuation of certain benefits based upon years of service. The severance package also included allowances related to the vesting of certain stock option awards during 2022 and the period in which the employee may exercise vested stock options after the termination of employment. These allowances are considered modifications to the Company's equity compensation plans.
All employees accepted into the program finished their employment. In accordance with accounting guidance, the Company was required to recognize all costs related to termination salary and benefits under the VSP in the period in which the participating employees are irrevocably accepted into the program and the amount is reasonably estimated. As a result, the Company recognized $54,756 in net personnel costs associated with the VSP during 2022. These personnel costs included stock-based compensation expense from modifications to the Company's equity compensation plans related to the vesting of stock options awarded to employees participating in the VSP net of options forfeited (See Note 7). The Company's personnel costs recognized from the VSP are reflected in Compensation, benefits and other personnel on the accompanying Consolidated Statements of Operations.
Note 15 – Business Acquisitions
LifeYield
On December 10, 2024, the Company acquired LifeYield, LLC (LifeYield), a Boston-based, tax-smart technology firm to provide real-time, automated unified managed household (UMH) capabilities in a cost-effective, fully bundled overlay solution.
82
Under the acquisition method of accounting, the total purchase price was allocated to the net tangible and intangible assets of LifeYield based upon their estimated fair values as of December 10, 2024.
The total purchase price for LifeYield was $29,000 , net of cash acquired, paid in cash at closing along with a contingent consideration of $11,910 subject to the achievement of certain post-closing performance measurements determined during a time period up to four years from the closing date.
The purchase price allocation related to the LifeYield acquisition is as follows:
| Estimated Fair Value | Estimated Useful Life | ||||||||||
| Other assets | $ | ||||||||||
| Goodwill | |||||||||||
| Identifiable intangible assets: | |||||||||||
| Acquired technology | |||||||||||
| Client relationships | |||||||||||
| Trade name | |||||||||||
| Current liabilities, net of current assets | ( |
||||||||||
| Long-term liabilities | ( |
||||||||||
| Contingent consideration | ( |
||||||||||
| Net cash consideration | $ | ||||||||||
The results of operations of LifeYield are included in the Investment Advisors segment and are reflected in the Company's Consolidated Statement of Operations since the completion of the acquisition. Any goodwill generated for income tax purposes from the acquisition is fully deductible (See Note 16).
Pro forma information has not been presented because the effect of the acquisition is not material to the Company's consolidated financial results.
XPS Pensions (Nexus) Limited
In November 2023, the Company's wholly-owned operating subsidiary in the United Kingdom, SIEL, acquired all of the outstanding equity of XPS Pensions (Nexus) Limited. The excess purchase price over the estimated value of the net tangible and identifiable intangible assets was allocated to goodwill. The total amount of goodwill from this transaction amounted to $14,492 and is included in the accompanying Consolidated Balance Sheets (See Note 16). The total purchase price for XPS Pensions (Nexus) Limited included a contingent consideration payable to the sellers subject to the achievement of certain post-closing performance measurements determined during intervals occurring within two years immediately following the closing date. During 2024, the Company made an adjustment of $1,547 which reduced the fair value of the contingent consideration. The fair value adjustment to the contingent consideration is reflected in Facilities, supplies and other costs on the Consolidated Statement of Operations. As of December 31, 2024, the fair value of the contingent consideration of $2,445 is included in Other long-term liabilities on the accompanying Balance Sheet.
Altigo
In December 2023, the Company acquired substantially all of the assets comprising Altigo. The excess purchase price over the estimated value of the net tangible and identifiable intangible assets was allocated to goodwill. The total amount of goodwill from this transaction amounted to $6,960 and is included in the accompanying Consolidated Balance Sheets (See Note 16).
83
Note 16 – Goodwill and Intangible Assets
The carrying amount of the Company's goodwill by segment at December 31, 2024 and 2023 is as follows:
| Investment Managers | Investment Advisors |
Institutional Investors | Investments in New Businesses | Total | ||||||||||||||||||||||||||||
| Balance, December 31, 2022 | $ | $ | $ | $ | ||||||||||||||||||||||||||||
| Acquisitions (See Note 15) | ||||||||||||||||||||||||||||||||
| Foreign currency translation adjustments | ( |
|||||||||||||||||||||||||||||||
| Balance, December 31, 2023 | $ | $ | $ | $ | $ | |||||||||||||||||||||||||||
| Acquisition of LifeYield (See Note 15) | ||||||||||||||||||||||||||||||||
| Measurement period adjustments | ||||||||||||||||||||||||||||||||
| Reclassification due to segment reorganization | ( |
|||||||||||||||||||||||||||||||
| Foreign currency translation adjustments | ( |
( |
( |
|||||||||||||||||||||||||||||
| Balance, December 31, 2024 | $ | $ | $ | $ | $ | |||||||||||||||||||||||||||
The reclassification of the Company's goodwill by segment during 2024 reflects the relative fair value allocation of the goodwill related to the businesses that were reclassified into the new segment (See Note 12).
The Company's intangible assets consist of:
| 2024 | Weighted Average Estimated Useful Life | 2023 | Weighted Average Estimated Useful Life | ||||||||||||||||||||
| Client relationships | $ |
|
$ | ||||||||||||||||||||
| Acquired technology |
|
||||||||||||||||||||||
| Trade name |
|
||||||||||||||||||||||
| Non-competition agreements |
|
||||||||||||||||||||||
|
|
|||||||||||||||||||||||
| Less: Accumulated amortization | ( |
( |
|||||||||||||||||||||
| Intangible assets, net | $ |
|
$ | ||||||||||||||||||||
The Company recognized $13,448 , $12,161 and $12,580 of amortization expense related to intangible assets during 2024, 2023 and 2022, respectively.
The Company currently expects to recognize amortization expense related to intangible assets as of December 31, 2024 each year from 2025 through 2029 as follows:
| Year | Expected Amortization Expense Related to Intangible Assets | ||||
| 2025 | $ | ||||
| 2026 | |||||
| 2027 | |||||
| 2028 | |||||
| 2029 | |||||
Note 17 – Revenues from Contracts with Customers
The Company’s principal sources of revenues are: (1) asset management, administration and distribution fees primarily earned based upon a contractual percentage of net assets under management or administration; and (2) information processing and software servicing fees that are either recurring and primarily earned based upon the number of trust accounts being serviced or a percentage of the market value of the clients' assets processed on the Company's platforms, or non-recurring and based upon project-oriented contractual agreements related to client implementations.
84
Disaggregation of Revenue
The following tables provide additional information pertaining to our revenues disaggregated by major product line and primary geographic market based on the location of the use of the products or services for each of the Company’s business segments for 2024, 2023 and 2022:
| Investment Managers |
Private
Banks
|
Investment Advisors |
Institutional Investors |
Investments in New Businesses |
Total | ||||||||||||||||||||||||||||||
| Major Product Lines: | For the Year Ended December 31, 2024 | ||||||||||||||||||||||||||||||||||
| Investment management fees from pooled investment products | $ | $ | $ | $ | $ | $ | |||||||||||||||||||||||||||||
| Investment management fees from investment management agreements | |||||||||||||||||||||||||||||||||||
| Investment operations fees | |||||||||||||||||||||||||||||||||||
| Investment processing fees - PaaS | |||||||||||||||||||||||||||||||||||
| Investment processing fees - SaaS | |||||||||||||||||||||||||||||||||||
| Professional services fees | |||||||||||||||||||||||||||||||||||
| Account fees and other | |||||||||||||||||||||||||||||||||||
| Total revenues | $ | $ | $ | $ | $ | $ | |||||||||||||||||||||||||||||
| Primary Geographic Markets: | |||||||||||||||||||||||||||||||||||
| United States | $ | $ | $ | $ | $ | $ | |||||||||||||||||||||||||||||
| United Kingdom | |||||||||||||||||||||||||||||||||||
| Canada | |||||||||||||||||||||||||||||||||||
| Ireland | |||||||||||||||||||||||||||||||||||
| Luxembourg | |||||||||||||||||||||||||||||||||||
| Total revenues | $ | $ | $ | $ | $ | $ | |||||||||||||||||||||||||||||
85
| Investment Managers |
Private Banks |
Investment Advisors |
Institutional Investors |
Investments in New Businesses |
Total | ||||||||||||||||||||||||||||||
| Major Product Lines: | For the Year Ended December 31, 2023 | ||||||||||||||||||||||||||||||||||
| Investment management fees from pooled investment products | $ | $ | $ | $ | $ | $ | |||||||||||||||||||||||||||||
| Investment management fees from investment management agreements | |||||||||||||||||||||||||||||||||||
| Investment operations fees | |||||||||||||||||||||||||||||||||||
| Investment processing fees - PaaS | |||||||||||||||||||||||||||||||||||
| Investment processing fees - SaaS | |||||||||||||||||||||||||||||||||||
Professional services fees (1)
|
|||||||||||||||||||||||||||||||||||
| Account fees and other | |||||||||||||||||||||||||||||||||||
| Total revenues | $ | $ | $ | $ | $ | $ | |||||||||||||||||||||||||||||
| Primary Geographic Markets: | |||||||||||||||||||||||||||||||||||
| United States (1) | $ | $ | $ | $ | $ | $ | |||||||||||||||||||||||||||||
| United Kingdom | |||||||||||||||||||||||||||||||||||
| Canada | |||||||||||||||||||||||||||||||||||
| Ireland | |||||||||||||||||||||||||||||||||||
| Luxembourg | |||||||||||||||||||||||||||||||||||
| Total revenues | $ | $ | $ | $ | $ | $ | |||||||||||||||||||||||||||||
(1) Professional services fees of the Private Banks segment includes a one-time early contractual buyout fee of $10,457 recorded during 2023 from an investment processing client acquired by an existing client.
| Investment Managers |
Private Banks |
Investment Advisors |
Institutional Investors |
Investments in New Businesses |
Total | ||||||||||||||||||||||||||||||
| Major Product Lines: | For the Year Ended December 31, 2022 | ||||||||||||||||||||||||||||||||||
| Investment management fees from pooled investment products | $ | $ | $ | $ | $ | $ | |||||||||||||||||||||||||||||
| Investment management fees from investment management agreements | |||||||||||||||||||||||||||||||||||
| Investment operations fees | |||||||||||||||||||||||||||||||||||
| Investment processing fees - PaaS | |||||||||||||||||||||||||||||||||||
| Investment processing fees - SaaS | |||||||||||||||||||||||||||||||||||
| Professional services fees (2) | |||||||||||||||||||||||||||||||||||
| Account fees and other | |||||||||||||||||||||||||||||||||||
| Total revenues | $ | $ | $ | $ | $ | $ | |||||||||||||||||||||||||||||
| Primary Geographic Markets: | |||||||||||||||||||||||||||||||||||
| United States | $ | $ | $ | $ | $ | $ | |||||||||||||||||||||||||||||
| United Kingdom (2) | |||||||||||||||||||||||||||||||||||
| Canada | |||||||||||||||||||||||||||||||||||
| Ireland | |||||||||||||||||||||||||||||||||||
| Luxembourg | |||||||||||||||||||||||||||||||||||
| Other | |||||||||||||||||||||||||||||||||||
| Total revenues | $ | $ | $ | $ | $ | $ | |||||||||||||||||||||||||||||
(2) Professional services fees of the Private Banks segment includes one-time early termination fees of $88,000 related to a contractual agreement with a significant client of the Company. In accordance with ASC 606, the entire amount of the fees received were recorded
86
Investment management fees from pooled investment products - Revenues associated with clients' assets invested in Company-sponsored pooled investment products. Contractual fees are stated as a percentage of the market value of assets under management and collected on a monthly basis. Revenues are recognized in Asset management, administration and distribution fees on the accompanying Consolidated Statements of Operations.
Investment management fees from investment management agreements - Revenues based on assets of clients of the Institutional Investors segment primarily invested in Company-sponsored products. Each client is charged an investment management fee that is stated as a percentage of the market value of all assets under management. The client is billed directly on a quarterly basis. Revenues are recognized in Asset management, administration and distribution fees on the accompanying Consolidated Statements of Operations.
Revenues associated with the separately managed account program offered through registered investment advisors located throughout the United States. The contractual fee is stated as a percentage of the market value of all assets invested in the separately managed account and collected on a quarterly basis. Revenues are recognized in Asset management, administration and distribution fees on the accompanying Consolidated Statements of Operations.
Investment operations fees - Revenues earned from accounting and administrative services, distribution support services and regulatory and compliance services to investment management firms and family offices. The Company contracts directly with the investment management firm or family office. The contractual fees are stated as a percentage of net assets under administration and billed when asset valuations are finalized. Also includes fees from client cash balances held in the FDIC-insured accounts through the SEI Integrated Cash program. Revenues are recognized in Asset management, administration and distribution fees on the accompanying Consolidated Statements of Operations.
Investment processing fees - Platform as a Service - Revenues associated with clients that outsource their entire investment operation and back-office processing functions. Through the use of the Company's proprietary platforms, the Company assumes all back-office investment processing services including investment processing, custody and safekeeping of assets, income collections, securities settlement and other related trust activities. The contractual fee is based on a monthly fee plus additional fees determined on a per-account or per-transaction basis. Contractual fees can also be stated as a percentage of the value of assets processed on the Company's platforms each month as long as the fee is in excess of a monthly contractual minimum. The client is billed directly on a monthly basis. Revenues are recognized in Information processing and software servicing fees on the accompanying Consolidated Statements of Operations.
Revenues associated with clients of the mutual fund trading solution are fees recognized for shareholder services and related services through the use of the Company's proprietary platform or through third-party vendor agreements. Contractual fees are stated as a percentage of the value of total assets or positions processed on the Company's platform or subject to third-party vendor agreements each month. Fees are billed and collected on a monthly and quarterly basis. These revenues were previously classified under Account fees and other in 2023 and have been reclassified to conform to the current year presentation.
Investment processing fees - Software as a Service - Revenues associated with clients of the Private Banks segment for application software services. Clients retain responsibility for all investment operations, client administration and other back-office trust operations. The contractual fee is based on a monthly fee plus additional fees determined on a per-account or per-transaction basis. The client is billed directly on a monthly basis.
Revenues associated with clients of the Investments in New Businesses segment processed on the Archway PlatformSM are fees for hosted technology services to family offices and financial institutions. The Archway Platform is an integrated technology platform used for investment, operations, accounting and client reporting by these institutions. The contractual fee is based on a monthly subscription fee to access the Archway Platform along with additional fees on a per transaction basis.
Revenues associated with clients of the Institutional Investors segment processed on the SEI NovusSM portfolio intelligence tool are fees for data management, performance measurement, reporting, and risk analytics. The contractual fee is based on a fixed fee to access SEI Novus and includes fees for integration of historical fund data and custom reporting.
All revenues from investment processing fees are recognized in Information processing and software servicing fees on the accompanying Consolidated Statements of Operations.
Professional services fees - Revenues associated with the business services migration for investment processing clients of the Private Banks segment and investment operations clients of the Investment Managers segment. In addition, Professional services include other services such as business transformation consulting. Typically fees are stated as a contractual fixed fee. The client is billed directly and fees are collected according to the terms of the agreement.
87
Account fees and other - Revenues associated with custody account servicing, account terminations, reimbursements received for out-of-pocket expenses, and other fees for the provision of ancillary services.
Note 18 – Leases
The Company has operating leases for corporate facilities and equipment. The Company's expense related to leases during 2024, 2023 and 2022 was $9,571 , $10,334 and $10,328 , respectively, and is included in Facilities, supplies and other costs on the accompanying Consolidated Statements of Operations. During 2024, 2023 and 2022 the Company incurred variable lease costs of $1,137 , $1,084 and $906 , respectively included in total expense.
The Company's future minimum lease payments under non-cancelable leases as of December 31, 2024 are as follows:
| Year | Future Minimum Lease Payment | |||||||
| 2025 | $ | |||||||
| 2026 | ||||||||
| 2027 | ||||||||
| 2028 | ||||||||
| 2029 | ||||||||
| Thereafter | ||||||||
| Total future minimum lease payments | ||||||||
| Less: Imputed interest | ( |
|||||||
| Total | $ | |||||||
The following table provides supplemental Consolidated Balance Sheet information related to the Company's leases:
| 2024 | 2023 | |||||||||||||
| Current portion of long-term operating lease liabilities | $ |
|
$ | |||||||||||
| Long-term operating lease liabilities |
|
|||||||||||||
| Total operating lease liabilities | $ |
|
$ | |||||||||||
| Weighted average remaining lease term | ||||||||||||||
| Weighted average discount rate |
|
% | % | |||||||||||
The following table provides supplemental cash flow information related to the Company's leases:
|
Year Ended December 31,
|
2024 | 2023 | 2022 | |||||||||||||||||
| Cash paid for amounts included in the measurement of lease liabilities | $ |
|
$ | $ | ||||||||||||||||
| Right-of-use assets obtained in exchange for lease obligations | $ |
|
$ | $ | ||||||||||||||||
As of December 31, 2024, the Company had no material lease commitments for leases that have not commenced.
Note 19 – Sale of Property
On July 8, 2024, the Company sold a condominium located in New York, New York. The Company recognized a net pre-tax gain of $8,151 after associated costs and expenses during 2024 as a result of the sale. The gain from the sale is reflected in Other income on the accompanying Consolidated Statement of Operations.
88
| Schedule II - Valuation and Qualifying Accounts and Reserves | SEI Investments Company | |||||||
| (In thousands) | and Subsidiaries | |||||||
| Year Ended December 31, | Additions | |||||||||||||||||||||||||||||||
| Description | Balance at Beginning of Year |
Charged to Costs and Expenses |
Charged to Other Accounts |
(Deductions) | Balance at End of Year |
|||||||||||||||||||||||||||
| Allowance for doubtful accounts: | ||||||||||||||||||||||||||||||||
| 2024 | $ | $ | $ | $ | $ | |||||||||||||||||||||||||||
| 2023 | ( |
|||||||||||||||||||||||||||||||
| 2022 | ( |
|||||||||||||||||||||||||||||||
| Deferred income tax valuation allowance: | ||||||||||||||||||||||||||||||||
| 2024 | $ | $ | $ | $ | ( |
$ | ||||||||||||||||||||||||||
| 2023 | ||||||||||||||||||||||||||||||||
| 2022 | ( |
|||||||||||||||||||||||||||||||
89
Item 9. Changes in and Disagreements With Accountants on Accounting and Financial Disclosure.
None.
Item 9A. Controls and Procedures.
Conclusion Regarding the Effectiveness of Disclosure Controls and Procedures
Under the supervision and with the participation of our management, including our Chief Executive Officer and Chief Financial Officer, we conducted an evaluation of the effectiveness of our disclosure controls and procedures, as such term is defined under Rule 13a-15(e) promulgated under the Securities Exchange Act of 1934, as amended (the Exchange Act), as of the end of the period covered by this report. Based on this evaluation, our Chief Executive Officer and Chief Financial Officer concluded that our disclosure controls and procedures are effective as of the end of the period covered by this annual report to provide reasonable assurance that the information required to be disclosed by us in reports filed under the Exchange Act is recorded, processed, summarized, and reported within the time periods specified in the SEC’s rules and forms. Disclosure controls and procedures include, without limitation, controls and procedures designed to ensure that information required to be disclosed by an issuer in the reports that it files or submits under the Act is accumulated and communicated to the issuer’s management including its principal executive and principal financial officers, or persons performing similar functions, as appropriate to allow timely decisions regarding required disclosure.
Management’s Report on Internal Control over Financial Reporting
Our management is responsible for establishing and maintaining adequate internal control over financial reporting, as such term is defined in Exchange Act Rule 13a-15(f). Under the supervision and with the participation of our management, including our Chief Executive Officer and Chief Financial Officer, we conducted an evaluation of the effectiveness of our internal control over financial reporting based on the framework in Internal Control – Integrated Framework (2013) issued by the Committee of Sponsoring Organizations of the Treadway Commission. Based on our evaluation under the framework in Internal Control – Integrated Framework (2013), our management concluded that our internal control over financial reporting was effective as of December 31, 2024.
The effectiveness of our internal control over financial reporting as of December 31, 2024 has been audited by KPMG LLP, an independent registered public accounting firm, as stated in their report which is included herein.
Changes in Internal Control over Financial Reporting
No change in our internal control over financial reporting occurred during the quarter ended December 31, 2024 that has materially affected, or is reasonably likely to materially affect, our internal control over financial reporting.
Item 9B. Other Information.
During the three months ended December 31, 2024, none of our officers or directors adopted terminated
Item 9C. Disclosure Regarding Foreign Jurisdictions that Prevent Inspections.
None.
90
PART III
Item 10. Directors, Executive Officers and Corporate Governance.
Identification of Executive Officers
The Board of Directors of the Company has determined that the Company’s executive officers within the meaning of Rule 3b-7 promulgated under the Securities Exchange Act of 1934, as amended, are as follows:
ALFRED P. WEST, JR., 82, has been the Executive Chairman of our Board of Directors since June 2022. Prior to June 2022, Mr. West served as our Chief Executive Officer since we were founded in 1968. Additionally, Mr. West also served as our President from June 1979 to August 1990.
RYAN P. HICKE, 47, has been an employee since May 1998, and our Chief Executive Officer since June 2022. Prior to his appointment as our Chief Executive Officer, Mr. Hicke was one of our Executive Vice Presidents from November 2018 until June 2022. Mr. Hicke served as our Chief Information Officer from November 2018 to June 2022, and was a Senior Vice President from 2015 until November 2018.
SEAN J. DENHAM, 52, has been one of our Executive Vice Presidents and has served as our Chief Financial Officer since April 2024. Prior to April 2024, Mr. Denham was a partner of Grant Thornton.
MICHAEL F. LANE, 57, has been an employee and one of our Executive Vice Presidents since September 2024. Prior to September 2024, Mr. Lane was Chair of U.S. Wealth at Blackrock after he was head of iShares for U.S. Wealth Advisory since 2018. Prior to 2018, Mr. Lane served as Global Head of Strategic Retirement Initiatives and CEO of Dimensional SmartNest LLC.
PHILIP N. MCCABE, 62, has been an employee since February 1989, and one of our Executive Vice Presidents since March 2022. Mr. McCabe was a Senior Vice President from January 2016 until March 2022.
MICHAEL N. PETERSON, 58, has been one of our Executive Vice Presidents and has served as our General Counsel since June 2018. Prior to February 2018, Mr. Peterson was a partner of Morgan, Lewis & Bockius LLP, a law firm, and from February 2018 until May 2018, Mr. Peterson was a partner of Reed Smith LLP, a law firm.
SANJAY K. SHARMA, 55, has been one of our Executive Vice Presidents since June 2022. Mr. Sharma was a Senior Vice President from August 2008 until June 2022.
MARK A. WARNER, 57, has been an employee since May 1990, and has served as our Chief Accounting Officer and Controller since March 2023.
Insider Trading Policy
The Company has an Insider Trading Policy that governs transactions in our securities by our directors, officers, and employees, and promotes compliance with the laws and rules applicable thereto. The Insider Trading Policy is filed with the Annual Report on Form 10-K as Exhibit 19.
Item 11. Executive Compensation.
Information required by this item is set forth under the caption “Executive Compensation” in the Company’s definitive proxy statement to be filed pursuant to Regulation 14A, which information is incorporated herein by reference.
91
Item 12. Security Ownership of Certain Beneficial Owners and Management and Related Stockholder Matters.
Information required by this item is set forth under the caption “Ownership of Shares” in the Company’s definitive proxy statement to be filed pursuant to Regulation 14A, which information is incorporated herein by reference.
The following table provides information regarding the aggregate number of securities to be issued under all of our equity compensation plans upon exercise of outstanding options, stock units, warrants, and other rights and their weighted-average exercise price as of December 31, 2024.
|
Number of
securities to be
issued upon
exercise of
outstanding options,
warrants and rights
(a)
|
Weighted –average exercise price of outstanding options, warrants and rights (b) |
Number of securities remaining available for future issuance under equity compensation plans (excluding securities reflected in column (a)) (c) |
||||||||||||||||||
| Equity compensation plans approved by security holders | 16,514,000 | $ | 62.27 | 13,602,000 | ||||||||||||||||
| Equity compensation plans not approved by security holders | — | — | — | |||||||||||||||||
| Total | 16,514,000 | $ | 62.27 | 13,602,000 | ||||||||||||||||
Item 13. Certain Relationships and Related Transactions, and Director Independence.
Information required by this item is set forth under the captions “Election of Directors,” “Executive Compensation,” and “Director Compensation” in the Company’s definitive proxy statement to be filed pursuant to Regulation 14A, which information is incorporated herein by reference.
Item 14. Principal Accountant Fees and Services.
Information required by this item is set forth under the caption “Ratification of Appointment of Independent Registered Public Accountants” in the Company’s definitive proxy statement to be filed pursuant to Regulation 14A, which information is incorporated herein by reference.
PART IV
Item 15. Exhibits and Financial Statement Schedules.
| 1 and 2. |
Financial Statements and Financial Statement Schedules. The following is a list of the Consolidated Financial Statements of the Company and its subsidiaries and supplementary data filed as part of Item 8 hereof:
|
||||
| Reports of Independent Registered Public Accounting Firm | |||||
| Consolidated Balance Sheets — December 31, 2024 and 2023 | |||||
| Consolidated Statements of Operations — For the years ended December 31, 2024, 2023 and 2022 | |||||
| Consolidated Statements of Comprehensive Income — For the years ended December 31, 2024, 2023 and 2022 | |||||
| Consolidated Statements of Changes in Equity — For the years ended December 31, 2024, 2023 and 2022 | |||||
| Consolidated Statements of Cash Flows — For the years ended December 31, 2024, 2023 and 2022 | |||||
| Notes to Consolidated Financial Statements | |||||
| Schedule II - Valuation and Qualifying Accounts and Reserves — For the years ended December 31, 2024, 2023 and 2022 | |||||
| All other schedules are omitted because they are not applicable, or not required, or because the required information is included in the Consolidated Financial Statements or notes thereto. | |||||
| 3. |
Exhibits, Including Those Incorporated by Reference. The exhibits to this Report are listed on the accompanying index to exhibits and are incorporated herein by reference or are filed as part of this Annual Report on Form 10-K.
|
||||
Item 16. Form 10-K Summary.
None.
92
EXHIBIT INDEX
The following is a list of exhibits filed as part of this annual report on Form 10-K. For exhibits incorporated by reference, the location of the exhibit in the previous filing is indicated in parentheses.
| 3.1 | (P) | Articles of Incorporation of the Registrant as amended on January 21, 1983. (Incorporated by reference to exhibit 3.1 to the Registrant’s Annual Report on Form 10-K for the fiscal year ended December 31, 1982.) | |||||||||
| 3.1.2 | (P) | Amendment to Articles of Incorporation of the Registrant, dated May 21, 1992. (Incorporated by reference to exhibit 3.1.2 to the Registrant’s Annual Report on Form 10-K for the fiscal year ended December 31, 1992.) | |||||||||
| 3.1.3 | (P) | Amendment to Articles of Incorporation of the Registrant, dated May 26, 1994. (Incorporated by reference to exhibit 3.1.3 to the Registrant’s Annual Report on Form 10-K for the fiscal year ended December 31, 1994.) | |||||||||
| 3.1.4 | (P) | Amendment to Articles of Incorporation of the Registrant, dated November 21, 1996. (Incorporated by reference to exhibit 3.1.4 to the Registrant’s Annual Report on Form 10-K for the fiscal year ended December 31, 1996.) | |||||||||
| 3.1.5 | |||||||||||
| 3.2 | |||||||||||
| Note: Exhibits 10.1 through 10.13 constitute the management contracts and executive compensatory plans or arrangements in which certain of the directors and executive officers of the Registrant participate. | |||||||||||
| 10.1 | |||||||||||
| 10.2 | |||||||||||
| 10.3 | |||||||||||
| 10.3.1 | |||||||||||
| 10.4 | |||||||||||
| 10.5 | |||||||||||
| 10.6 | |||||||||||
| 10.7 | |||||||||||
| 10.7.1 | |||||||||||
| 10.8 | |||||||||||
| 10.9 | |||||||||||
93
| 10.10 | |||||||||||
| 10.11 | |||||||||||
| 10.12 | |||||||||||
| 10.13 | * | ||||||||||
| 10.14 | |||||||||||
| 10.14.1 | |||||||||||
| 14 | |||||||||||
| 19 | * | ||||||||||
| 21 | * | ||||||||||
| 23.1 | * | ||||||||||
| 23.2 | * | ||||||||||
| 31.1 | * | ||||||||||
| 31.2 | * | ||||||||||
| 32 | * | ||||||||||
| 97 | |||||||||||
| 99.1 | |||||||||||
| 99.2 | |||||||||||
| 99.3 | |||||||||||
| 99.4 | * | ||||||||||
| 101.INS | XBRL Instance Document - the instance document does not appear in the Interactive Data File because its XBRL tags are embedded within the Inline XBRL document. |
||||||||||
| 101.SCH | * | XBRL Taxonomy Extension Schema Document | |||||||||
| 101.CAL | * | XBRL Taxonomy Extension Calculation Linkbase Document | |||||||||
| 101.LAB | * | XBRL Taxonomy Extension Label Linkbase Document | |||||||||
| 101.PRE | * | XBRL Taxonomy Extension Presentation Linkbase Document | |||||||||
| 101.DEF | * | XBRL Taxonomy Extension Definition Linkbase Document | |||||||||
| * | Filed herewith as an exhibit to this Annual Report on Form 10-K. | ||||
| (P) | Paper exhibit. | ||||
94
SIGNATURES
Pursuant to the requirements of Section 13 or 15(d) of the Securities Exchange Act of 1934, the registrant has duly caused this report to be signed on its behalf by the undersigned, thereunto duly authorized.
| SEI INVESTMENTS COMPANY | |||||||||||||||||
| Date: | February 20, 2025 | By: | /s/ Sean J. Denham | ||||||||||||||
| Sean J. Denham | |||||||||||||||||
| Chief Financial Officer | |||||||||||||||||
Pursuant to the requirements of the Securities Exchange Act of 1934, this report has been signed below by the following persons on behalf of the registrant and in the capacities and on the dates indicated.
| Date: | February 20, 2025 | By: | /s/ Alfred P. West, Jr. | ||||||||||||||
| Alfred P. West, Jr. | |||||||||||||||||
| Executive Chairman of the Board and Director | |||||||||||||||||
| Date: | February 20, 2025 | By: | /s/ Ryan P. Hicke | ||||||||||||||
| Ryan P. Hicke | |||||||||||||||||
| Chief Executive Officer and Director | |||||||||||||||||
| Date: | February 20, 2025 | By: | /s/ Carmen V. Romeo | ||||||||||||||
| Carmen V. Romeo | |||||||||||||||||
| Director | |||||||||||||||||
| Date: | February 20, 2025 | By: | /s/ William M. Doran | ||||||||||||||
| William M. Doran | |||||||||||||||||
| Director | |||||||||||||||||
| Date: | February 20, 2025 | By: | /s/ Kathryn M. McCarthy | ||||||||||||||
| Kathryn M. McCarthy | |||||||||||||||||
| Director | |||||||||||||||||
| Date: | February 20, 2025 | By: | /s/ Stephanie D. Miller | ||||||||||||||
| Stephanie D. Miller | |||||||||||||||||
| Director | |||||||||||||||||
| Date: | February 20, 2025 | By: | /s/ Carl A. Guarino | ||||||||||||||
| Carl A. Guarino | |||||||||||||||||
| Director | |||||||||||||||||
| Date: | February 20, 2025 | By: | /s/ Jonathan A. Brassington | ||||||||||||||
| Jonathan A. Brassington | |||||||||||||||||
| Director | |||||||||||||||||
95