EARNINGS PRESENTATION
Published on April 23, 2025
SEI Investments Company (NASDAQ: SEIC) Q1 2025 Earnings Presentation
This presentation contains forward-looking statements within the meaning or the rules and regulations of the Securities and Exchange Commission. In some cases you can identify forward- looking statements by terminology, such as "may," "will," "expect," "believe," ”remain” and "continue" or "appear." Our forward-looking statements include our current expectations as to: • our ability to maintain our sales momentum; • how we are reshaping our operating model, deepening client engagement and relationships, strengthening our talent, and sharpening our strategic vision, if at all; • our ability to serve the world’s most sophisticated institutional, wealth, and asset management organizations; • the ability of Aquiline to accelerate the growth and adoption of our Family Office Services platform that we sold to Aquiline; • our strategic priorities and our ability to execute against these priorities; • the strength of our position to address the current and future uncertainties; • the impacts of market uncertainty; • the momentum, strength and resiliency of our pipelines and business units; • our investment priorities; • our ability to deliver sustained, long-term growth and shareholder value; • the demand for our products and services; • the degree to which, if any, new sales events will result in revenue; • the timing and magnitude of certain investments to support business growth as well the effect these expenses may have on margins; • the headwinds that may affect our businesses; • the opportunities available to us for growth and to gain share in the markets in which we currently, and seek to, participate; • the performance of our various businesses, including the margins and profitability of such businesses and the events that may affect the margins, profitability and growth prospects of these businesses; • the benefits, if any, that we or our clients may derive from acquired assets; • the strength and elements of our balance sheet; • the strength of our pipelines and the momentum that each may have; • the benefits of our expense management efforts and our focus on these efforts; • our run rate and the stability of the elements of that run rate; • the effects of any change to the federal funds rate on our businesses or products and the revenue associated with these items; • our ability to build an ecosystem that can meet the needs of larger and more sophisticated advisors and the degree to which these investments will provide the capability to move upmarket; • the amount of revenue we may generate from the cash balances in our Integrated Cash Program, the degree to which the revenue we generate will moderate and the potential causation of this moderation, if any; • the degree to which alternative managers are positioned to excel; • the amount, if any, of management fees that may be received by LSV and the contribution of such management fees to our equity income; • the resiliency of our business; and • the market dynamics affecting our businesses. You should not place undue reliance on our forward-looking statements, as they are based on the current beliefs and expectations of our management and subject to significant risks and uncertainties, many of which are beyond our control or are subject to change. Although we believe the assumptions upon which we base our forward-looking statements are reasonable, they could be inaccurate. Some of the risks and important factors that could cause actual results to differ from those described in our forward-looking statements can be found in the "Risk Factors" section of our Annual Report on Form 10-K for the year ended Dec. 31, 2024, filed with the Securities and Exchange Commission. Past performance does not guarantee future results. Safe Harbor Statement 2 SEI Earnings PresentationQ1 2025
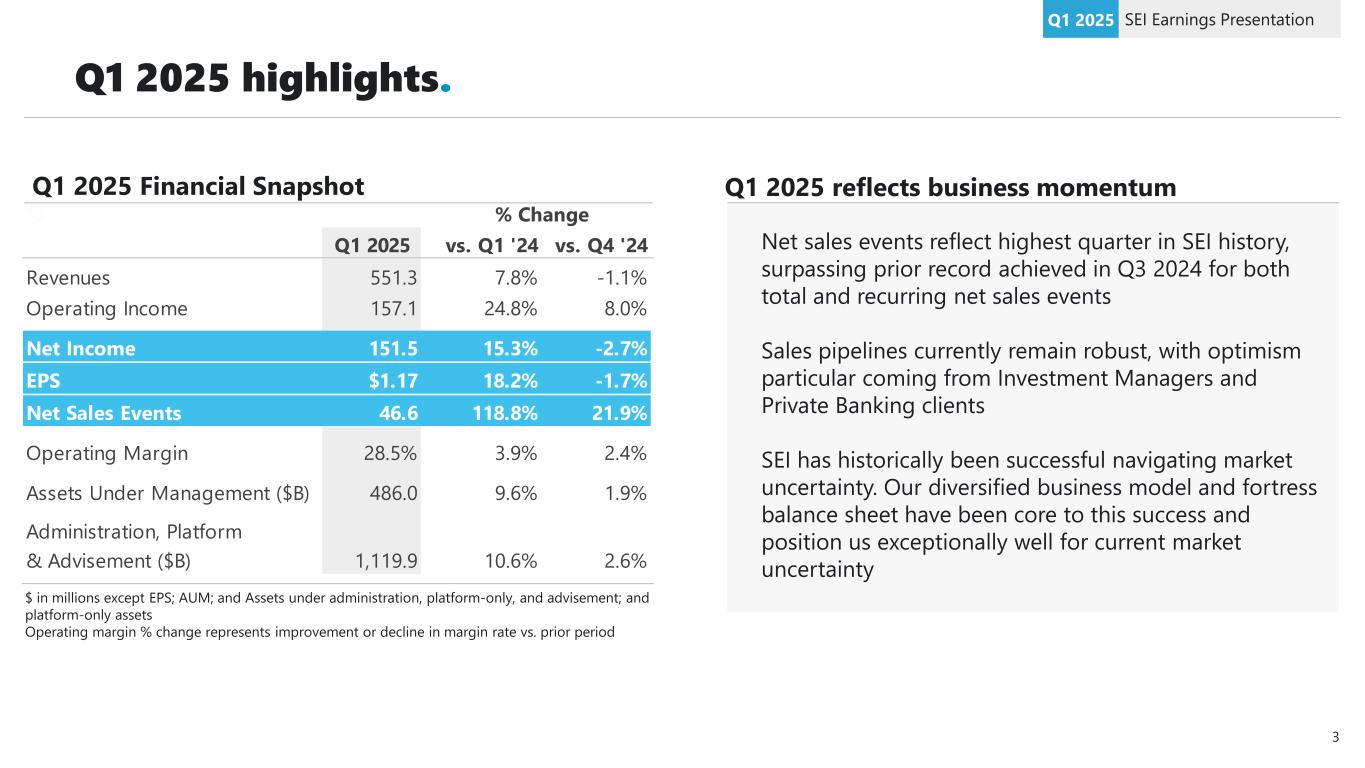
Q1 2025 vs. Q1 '24 vs. Q4 '24 Revenues 551.3 7.8% -1.1% Operating Income 157.1 24.8% 8.0% Net Income 151.5 15.3% -2.7% EPS $1.17 18.2% -1.7% Net Sales Events 46.6 118.8% 21.9% Operating Margin 28.5% 3.9% 2.4% Assets Under Management ($B) 486.0 9.6% 1.9% Administration, Platform & Advisement ($B) 1,119.9 10.6% 2.6% % Change Q1 2025 highlights. SEI Earnings PresentationQ1 2025 Net sales events reflect highest quarter in SEI history, surpassing prior record achieved in Q3 2024 for both total and recurring net sales events Sales pipelines currently remain robust, with optimism particular coming from Investment Managers and Private Banking clients SEI has historically been successful navigating market uncertainty. Our diversified business model and fortress balance sheet have been core to this success and position us exceptionally well for current market uncertainty $ in millions except EPS; AUM; and Assets under administration, platform-only, and advisement; and platform-only assets Operating margin % change represents improvement or decline in margin rate vs. prior period Q1 2025 reflects business momentum Q1 2025 Financial Snapshot 3
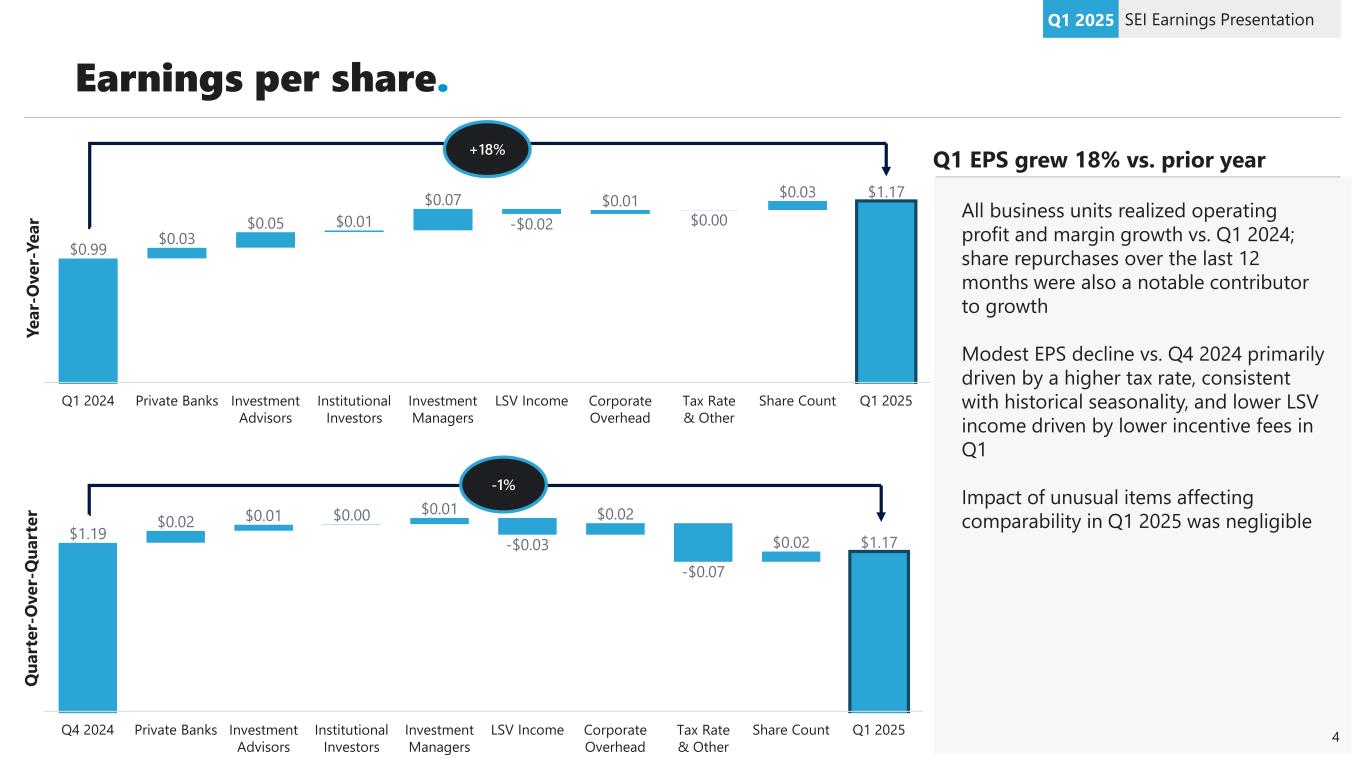
Earnings per share. SEI Earnings PresentationQ1 2025 All business units realized operating profit and margin growth vs. Q1 2024; share repurchases over the last 12 months were also a notable contributor to growth Modest EPS decline vs. Q4 2024 primarily driven by a higher tax rate, consistent with historical seasonality, and lower LSV income driven by lower incentive fees in Q1 Impact of unusual items affecting comparability in Q1 2025 was negligible Q1 EPS grew 18% vs. prior year $0.99 $0.03 $0.05 $0.01 $0.07 -$0.02 $0.01 $0.00 $0.03 $1.17 Q1 2024 Private Banks Investment Advisors Institutional Investors Investment Managers LSV Income Corporate Overhead Tax Rate & Other Share Count Q1 2025 +18% $1.19 $0.02 $0.01 $0.00 $0.01 -$0.03 $0.02 -$0.07 $0.02 $1.17 Q4 2024 Private Banks Investment Advisors Institutional Investors Investment Managers LSV Income Corporate Overhead Tax Rate & Other Share Count Q1 2025 -1% Ye ar -O ve r- Ye ar Q ua rt er -O ve r- Q ua rt er 4
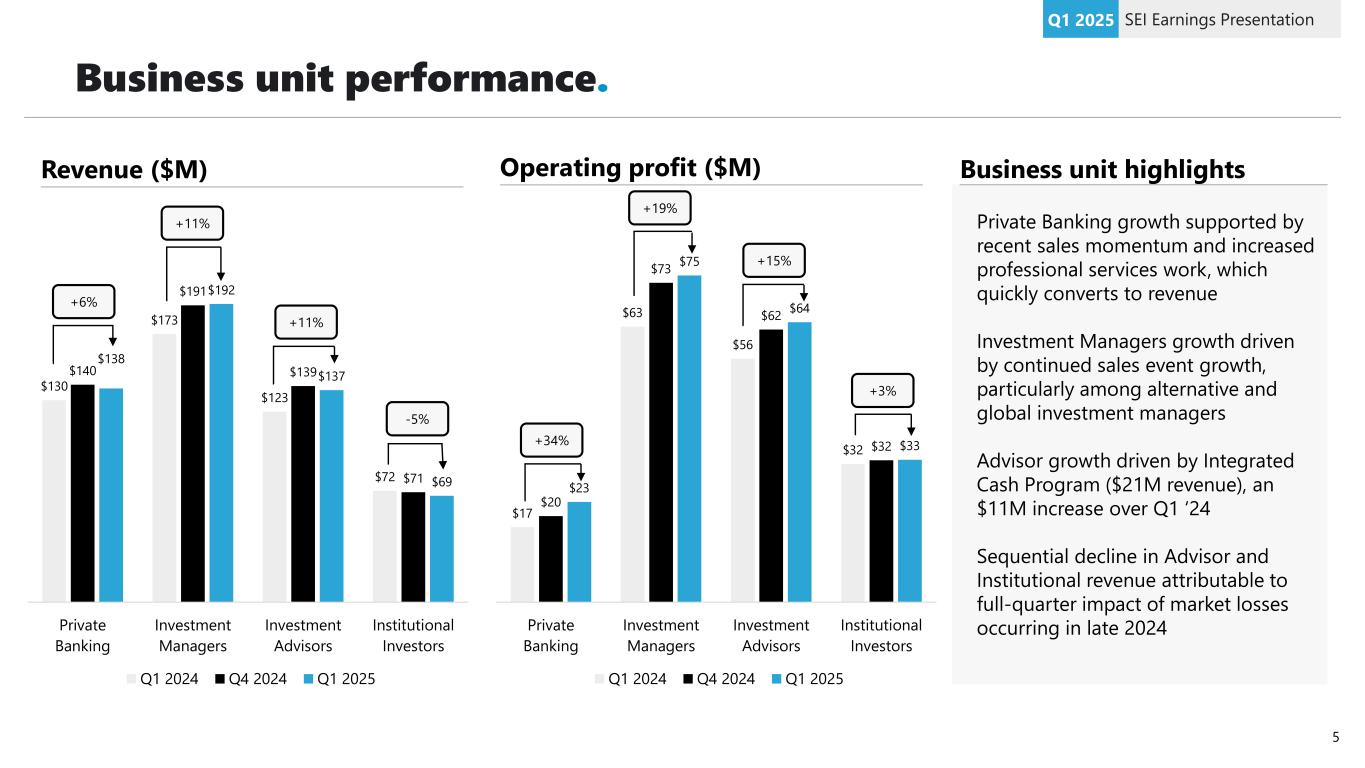
Business unit performance. SEI Earnings PresentationQ1 2025 Revenue ($M) Private Banking growth supported by recent sales momentum and increased professional services work, which quickly converts to revenue Investment Managers growth driven by continued sales event growth, particularly among alternative and global investment managers Advisor growth driven by Integrated Cash Program ($21M revenue), an $11M increase over Q1 ‘24 Sequential decline in Advisor and Institutional revenue attributable to full-quarter impact of market losses occurring in late 2024 Business unit highlightsOperating profit ($M) $130 $173 $123 $72 $140 $191 $139 $71 $138 $192 $137 $69 Private Banking Investment Managers Investment Advisors Institutional Investors Q1 2024 Q4 2024 Q1 2025 $17 $63 $56 $32 $20 $73 $62 $32 $23 $75 $64 $33 Private Banking Investment Managers Investment Advisors Institutional Investors Q1 2024 Q4 2024 Q1 2025 +6% +11% +11% -5% +34% +19% +15% +3% 5
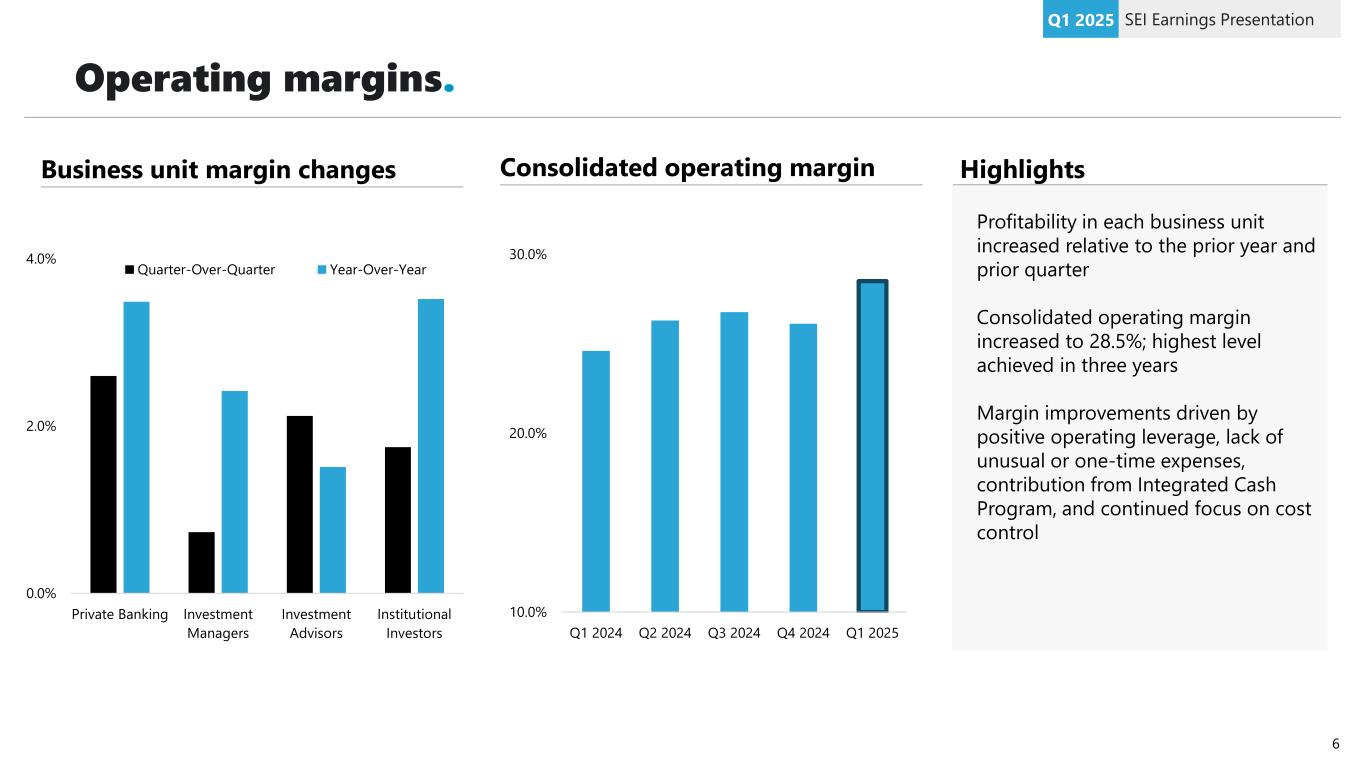
Operating margins. SEI Earnings PresentationQ1 2025 0.0% 2.0% 4.0% Private Banking Investment Managers Investment Advisors Institutional Investors Quarter-Over-Quarter Year-Over-Year Business unit margin changes HighlightsConsolidated operating margin 10.0% 20.0% 30.0% Q1 2024 Q2 2024 Q3 2024 Q4 2024 Q1 2025 Profitability in each business unit increased relative to the prior year and prior quarter Consolidated operating margin increased to 28.5%; highest level achieved in three years Margin improvements driven by positive operating leverage, lack of unusual or one-time expenses, contribution from Integrated Cash Program, and continued focus on cost control 6
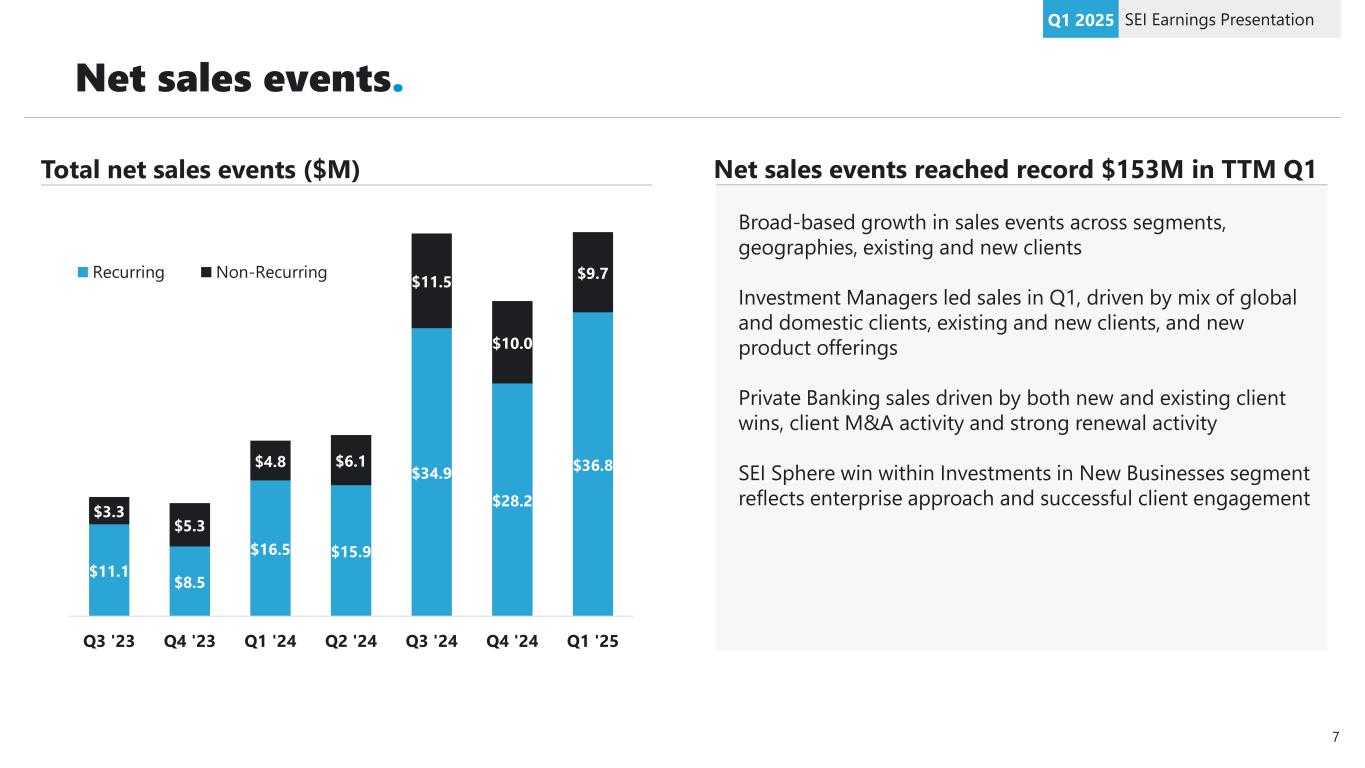
Net sales events. SEI Earnings PresentationQ1 2025 $11.1 $8.5 $16.5 $15.9 $34.9 $28.2 $36.8 $3.3 $5.3 $4.8 $6.1 $11.5 $10.0 $9.7 Q3 '23 Q4 '23 Q1 '24 Q2 '24 Q3 '24 Q4 '24 Q1 '25 Recurring Non-Recurring Total net sales events ($M) Broad-based growth in sales events across segments, geographies, existing and new clients Investment Managers led sales in Q1, driven by mix of global and domestic clients, existing and new clients, and new product offerings Private Banking sales driven by both new and existing client wins, client M&A activity and strong renewal activity SEI Sphere win within Investments in New Businesses segment reflects enterprise approach and successful client engagement Net sales events reached record $153M in TTM Q1 7
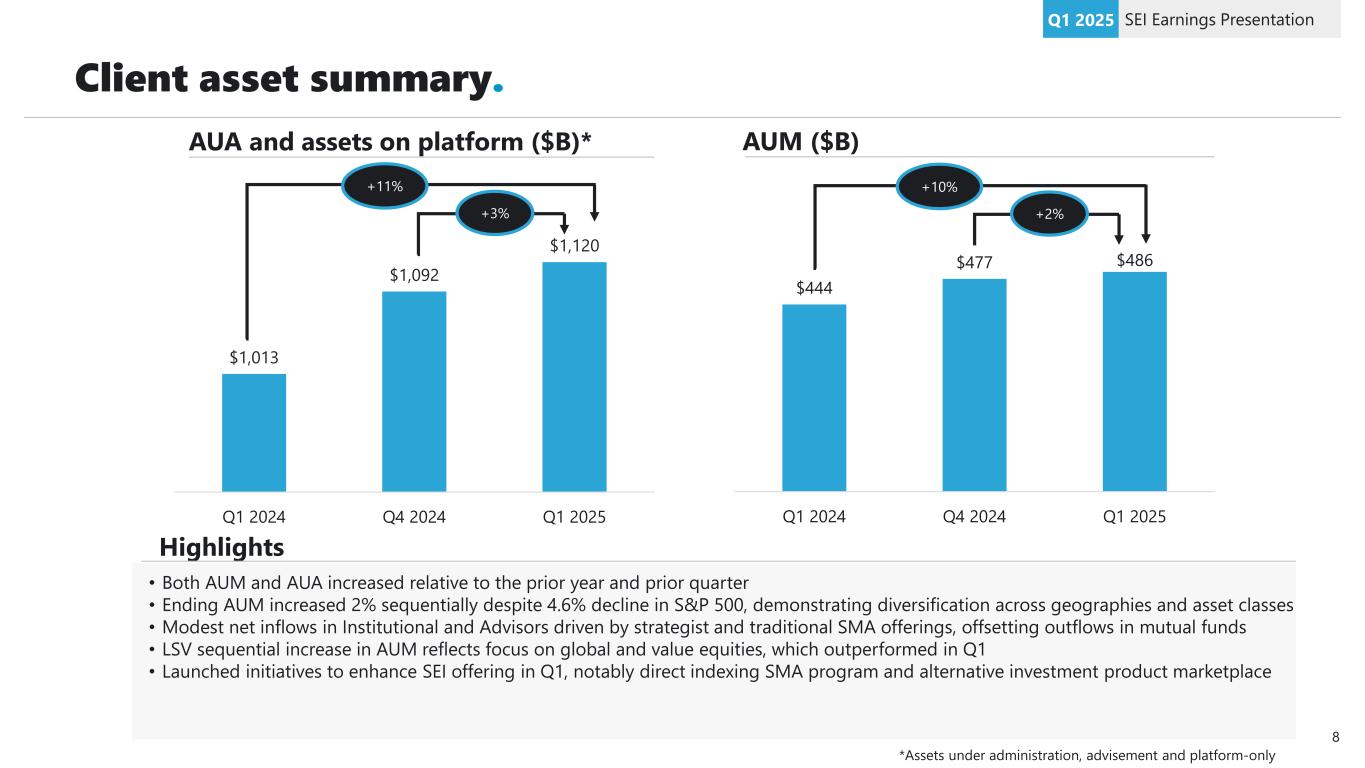
Client asset summary. SEI Earnings PresentationQ1 2025 AUA and assets on platform ($B)* AUM ($B) $1,013 $1,092 $1,120 Q1 2024 Q4 2024 Q1 2025 +11% +3% $444 $477 $486 Q1 2024 Q4 2024 Q1 2025 +10% +2% Highlights • Both AUM and AUA increased relative to the prior year and prior quarter • Ending AUM increased 2% sequentially despite 4.6% decline in S&P 500, demonstrating diversification across geographies and asset classes • Modest net inflows in Institutional and Advisors driven by strategist and traditional SMA offerings, offsetting outflows in mutual funds • LSV sequential increase in AUM reflects focus on global and value equities, which outperformed in Q1 • Launched initiatives to enhance SEI offering in Q1, notably direct indexing SMA program and alternative investment product marketplace *Assets under administration, advisement and platform-only 8
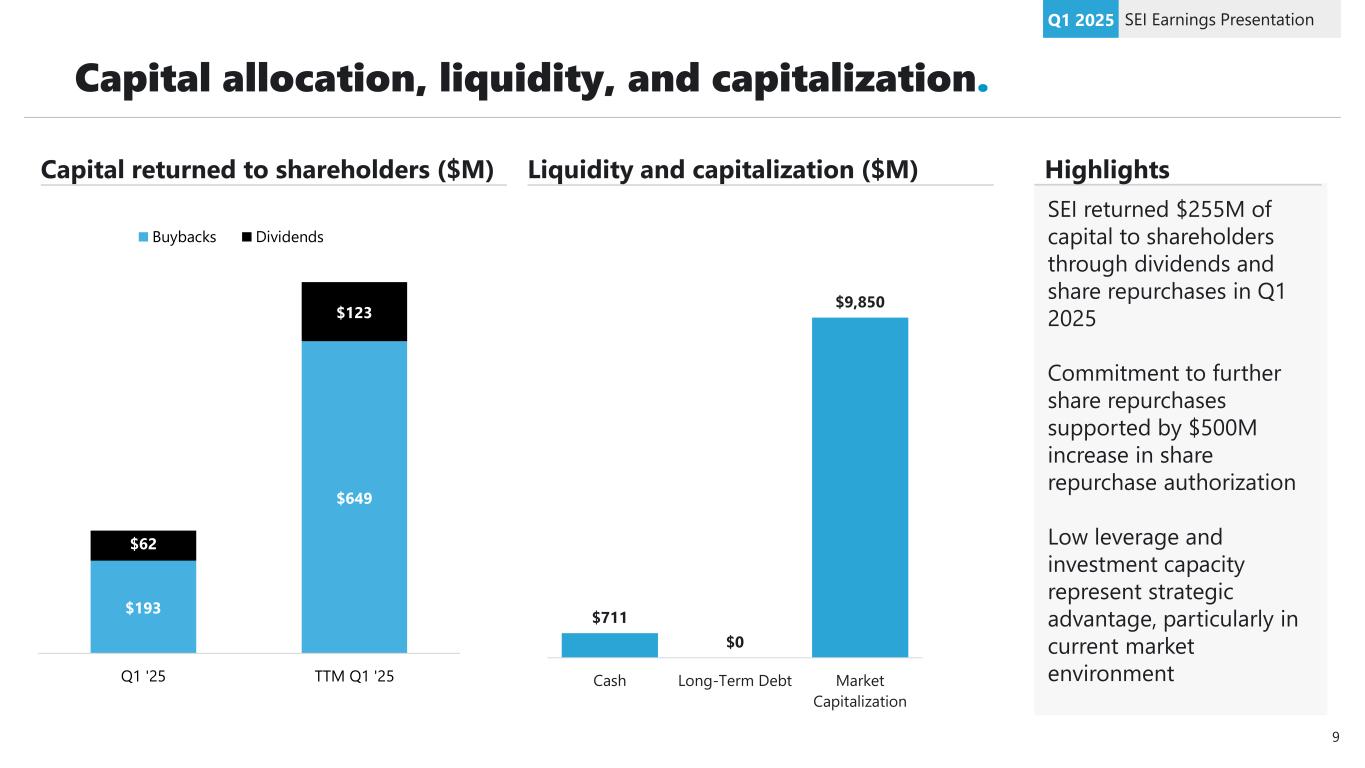
Capital allocation, liquidity, and capitalization. SEI Earnings PresentationQ1 2025 $193 $649 $62 $123 Q1 '25 TTM Q1 '25 Buybacks Dividends Capital returned to shareholders ($M) Liquidity and capitalization ($M) $711 $0 $9,850 Cash Long-Term Debt Market Capitalization SEI returned $255M of capital to shareholders through dividends and share repurchases in Q1 2025 Commitment to further share repurchases supported by $500M increase in share repurchase authorization Low leverage and investment capacity represent strategic advantage, particularly in current market environment Highlights 9

For institutional investor and financial advisor use only. Not for distribution to general public. Thank You 10