EARNINGS PRESENTATION
Published on July 23, 2025
SEI Investments Company (NASDAQ: SEIC) Q2 2025 Earnings Presentation
This presentation contains forward-looking statements within the meaning or the rules and regulations of the Securities and Exchange Commission. In some cases you can identify forward- looking statements by terminology, such as "may," "will," "expect," "believe," ”remain” and "continue" or "appear." Our forward-looking statements include our current expectations as to: • the benefits that we and our stakeholders will receive as a consequence of our partnership with Stratos Wealth Management; • our commitment to long-term growth, innovation and accountability; • our focus on execution and the benefits of this focus: • our ability to maintain our sales momentum; • when we will receive the benefits, if at all, of the investments we make; • our cost controls; • the impact of our resource allocations; • our potential, both short and long-term; • the duration of market weaknesses and the effect on us; • the degree to which our hiring will lead to improved execution and support our growth; • the stability of our margins; • the pace of our sales events and market conditions in the second half of 2025; • the timing of the closing of our partnership with Stratos Wealth Management; • the source of our funding of our purchase of the equity of Stratos Wealth Management; • the evolution of our go to market strategy; • our ability to serve the world’s most sophisticated institutional, wealth, and asset management organizations; • our strategic priorities and our ability to execute against these priorities; • the strength of our position to address the current and future uncertainties; • the impacts of market uncertainty; • our investment priorities; • our ability to deliver sustained, long-term growth and shareholder value; • the demand for our products and services; • the headwinds that may affect our businesses; • the opportunities available to us for growth and to gain share in the markets or regions in which we currently, and seek to, participate; • the performance of our various businesses, including the margins and profitability of such businesses and the events that may affect the margins, profitability and growth prospects of these businesses; • the drivers of future revenue, margin and earnings growth; • the benefits, if any, that we or our clients may derive from acquired assets; • the strength and elements of our balance sheet; • the strength of our pipelines and the momentum that each may have; • our run rate and the stability of the elements of that run rate; • the resiliency of our business; and • the market dynamics affecting our businesses. You should not place undue reliance on our forward-looking statements, as they are based on the current beliefs and expectations of our management and subject to significant risks and uncertainties, many of which are beyond our control or are subject to change. Although we believe the assumptions upon which we base our forward-looking statements are reasonable, they could be inaccurate. Some of the risks and important factors that could cause actual results to differ from those described in our forward-looking statements can be found in the "Risk Factors" section of our Annual Report on Form 10-K for the year ended Dec. 31, 2024, filed with the Securities and Exchange Commission. Past performance does not guarantee future results. Safe Harbor Statement 2 SEI Earnings PresentationQ2 2025
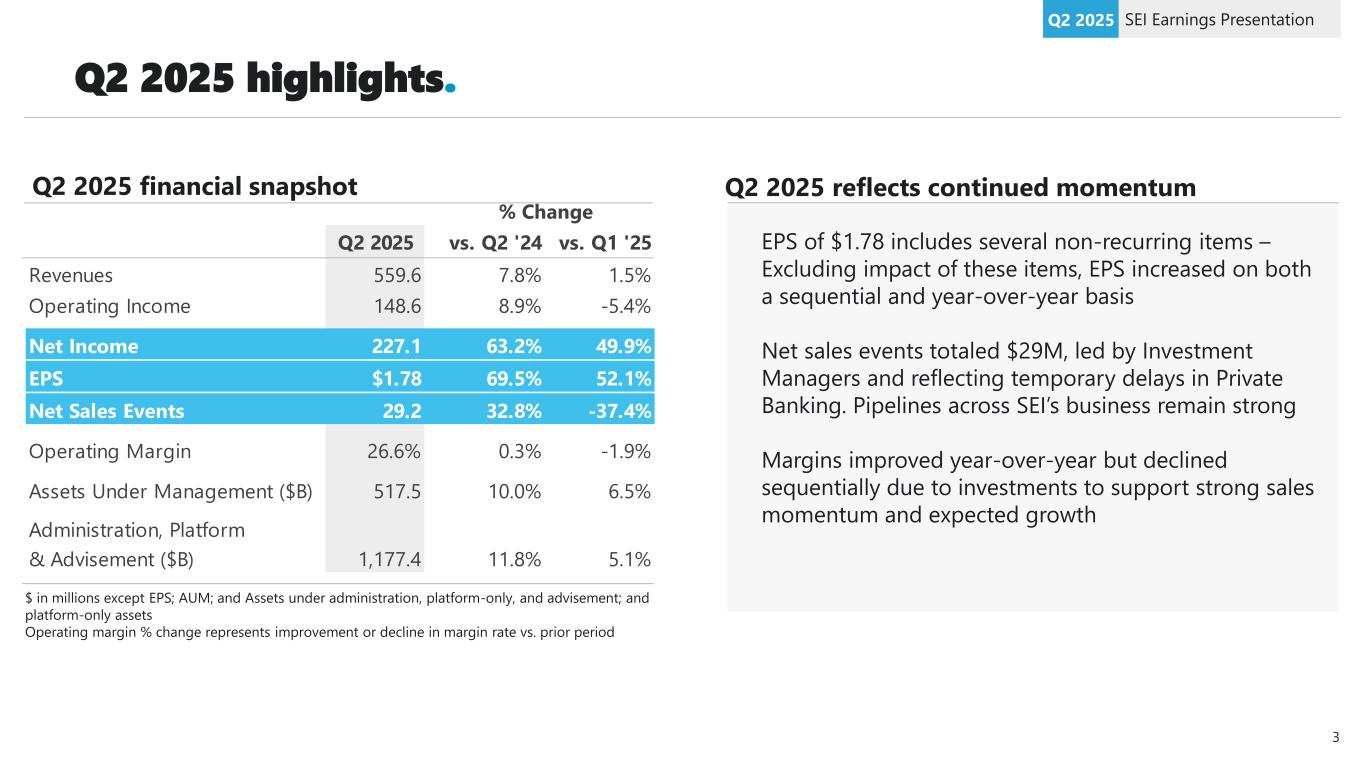
Q2 2025 vs. Q2 '24 vs. Q1 '25 Revenues 559.6 7.8% 1.5% Operating Income 148.6 8.9% -5.4% Net Income 227.1 63.2% 49.9% EPS $1.78 69.5% 52.1% Net Sales Events 29.2 32.8% -37.4% Operating Margin 26.6% 0.3% -1.9% Assets Under Management ($B) 517.5 10.0% 6.5% Administration, Platform & Advisement ($B) 1,177.4 11.8% 5.1% % Change Q2 2025 highlights. SEI Earnings PresentationQ2 2025 EPS of $1.78 includes several non-recurring items – Excluding impact of these items, EPS increased on both a sequential and year-over-year basis Net sales events totaled $29M, led by Investment Managers and reflecting temporary delays in Private Banking. Pipelines across SEI’s business remain strong Margins improved year-over-year but declined sequentially due to investments to support strong sales momentum and expected growth $ in millions except EPS; AUM; and Assets under administration, platform-only, and advisement; and platform-only assets Operating margin % change represents improvement or decline in margin rate vs. prior period Q2 2025 reflects continued momentumQ2 2025 financial snapshot 3
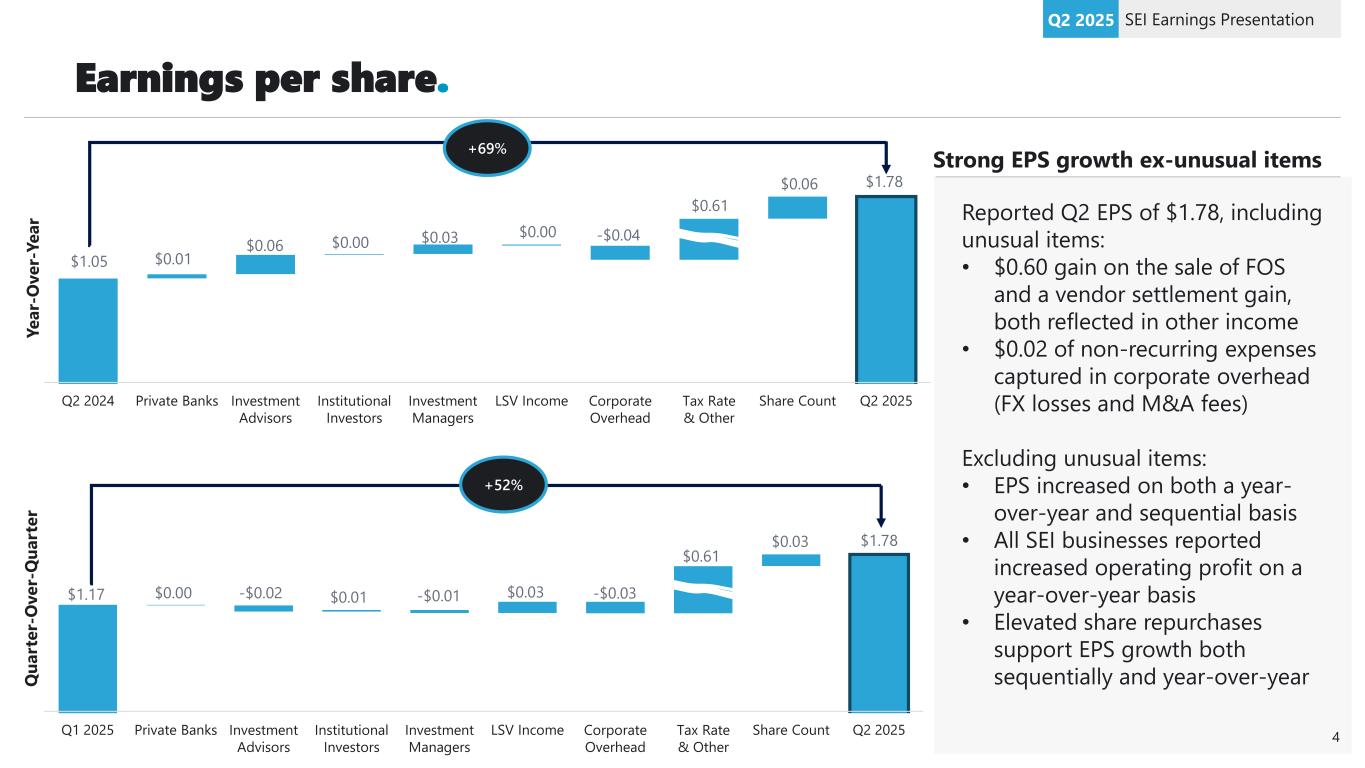
Earnings per share. SEI Earnings PresentationQ2 2025 Reported Q2 EPS of $1.78, including unusual items: • $0.60 gain on the sale of FOS and a vendor settlement gain, both reflected in other income • $0.02 of non-recurring expenses captured in corporate overhead (FX losses and M&A fees) Excluding unusual items: • EPS increased on both a year- over-year and sequential basis • All SEI businesses reported increased operating profit on a year-over-year basis • Elevated share repurchases support EPS growth both sequentially and year-over-year Strong EPS growth ex-unusual items Q2 2024 Private Banks Investment Advisors Institutional Investors Investment Managers LSV Income Corporate Overhead Tax Rate & Other Share Count Q2 2025 +69% Q1 2025 Private Banks Investment Advisors Institutional Investors Investment Managers LSV Income Corporate Overhead Tax Rate & Other Share Count Q2 2025 +52% Y e a r- O v e r- Y e a r Q u a rt e r- O v e r- Q u a rt e r 4 $1.05 $0.01 $0.06 $0.00 $0.03 $0.00 -$0.04 $0.61 $0.06 $1.78 $1.17 $0.00 -$0.02 $0.01 -$0.01 $0.03 -$0.03 $0.61 $0.03 $1.78
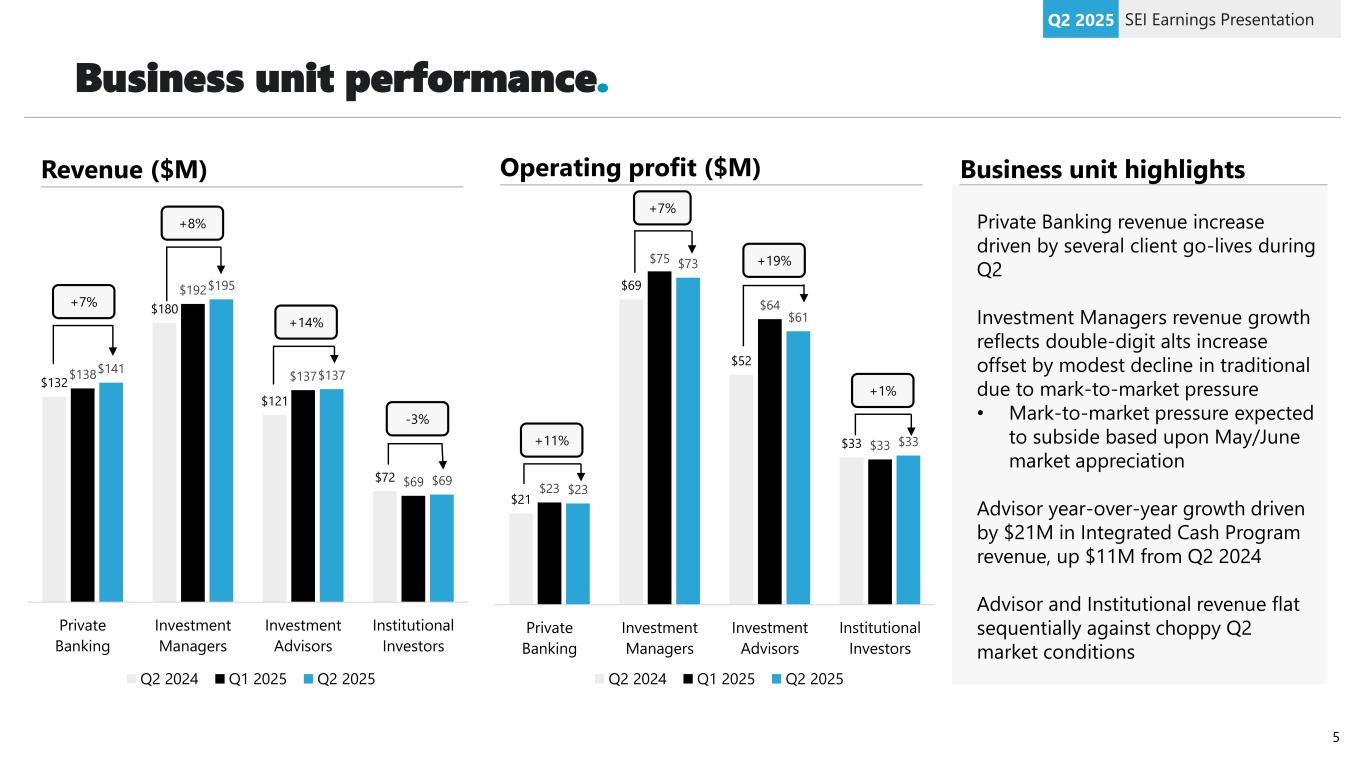
Business unit performance. SEI Earnings PresentationQ2 2025 Revenue ($M) Private Banking revenue increase driven by several client go-lives during Q2 Investment Managers revenue growth reflects double-digit alts increase offset by modest decline in traditional due to mark-to-market pressure • Mark-to-market pressure expected to subside based upon May/June market appreciation Advisor year-over-year growth driven by $21M in Integrated Cash Program revenue, up $11M from Q2 2024 Advisor and Institutional revenue flat sequentially against choppy Q2 market conditions Business unit highlightsOperating profit ($M) $132 $180 $121 $72 $138 $192 $137 $69 $141 $195 $137 $69 Private Banking Investment Managers Investment Advisors Institutional Investors Q2 2024 Q1 2025 Q2 2025 $21 $69 $52 $33 $23 $75 $64 $33 $23 $73 $61 $33 Private Banking Investment Managers Investment Advisors Institutional Investors Q2 2024 Q1 2025 Q2 2025 +7% +8% +14% -3% +11% +7% +19% +1% 5
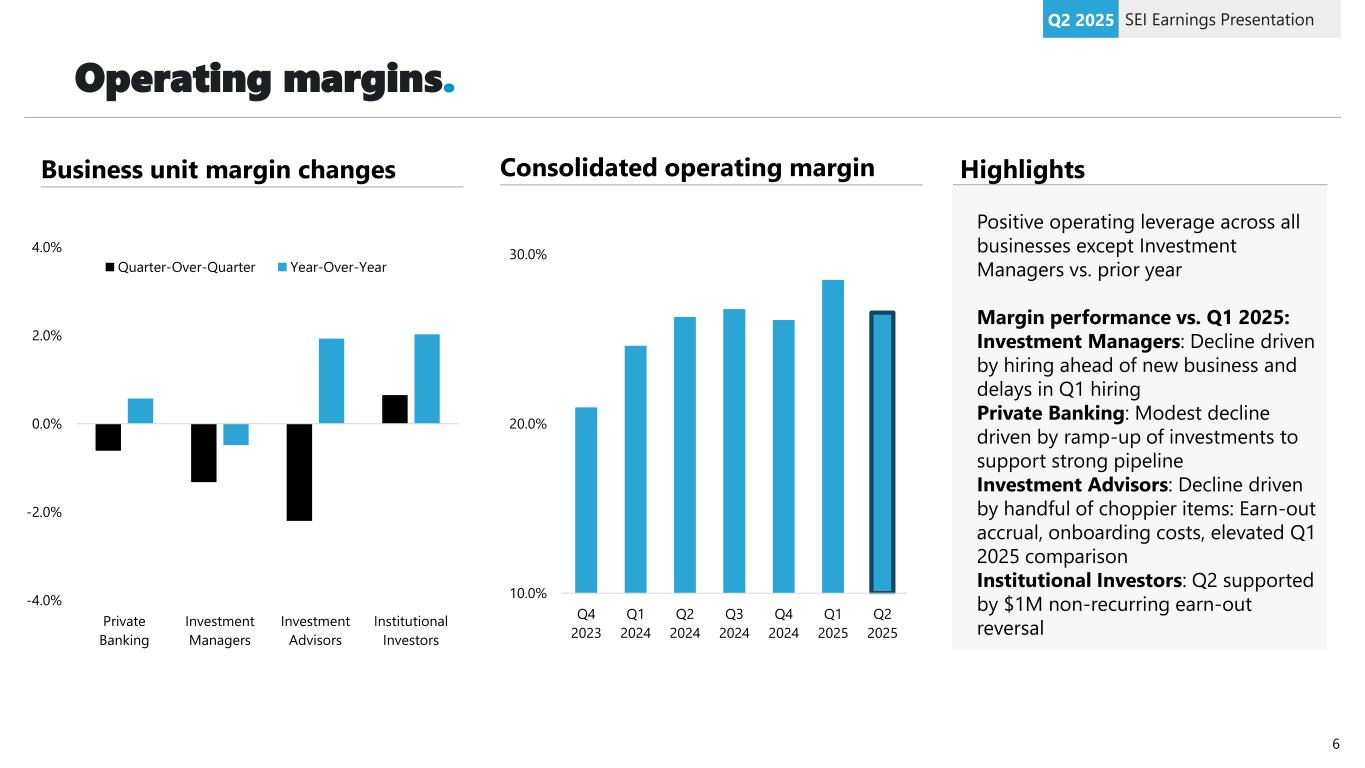
Operating margins. SEI Earnings PresentationQ2 2025 -4.0% -2.0% 0.0% 2.0% 4.0% Private Banking Investment Managers Investment Advisors Institutional Investors Quarter-Over-Quarter Year-Over-Year Business unit margin changes HighlightsConsolidated operating margin 10.0% 20.0% 30.0% Q4 2023 Q1 2024 Q2 2024 Q3 2024 Q4 2024 Q1 2025 Q2 2025 Positive operating leverage across all businesses except Investment Managers vs. prior year Margin performance vs. Q1 2025: Investment Managers: Decline driven by hiring ahead of new business and delays in Q1 hiring Private Banking: Modest decline driven by ramp-up of investments to support strong pipeline Investment Advisors: Decline driven by handful of choppier items: Earn-out accrual, onboarding costs, elevated Q1 2025 comparison Institutional Investors: Q2 supported by $1M non-recurring earn-out reversal 6
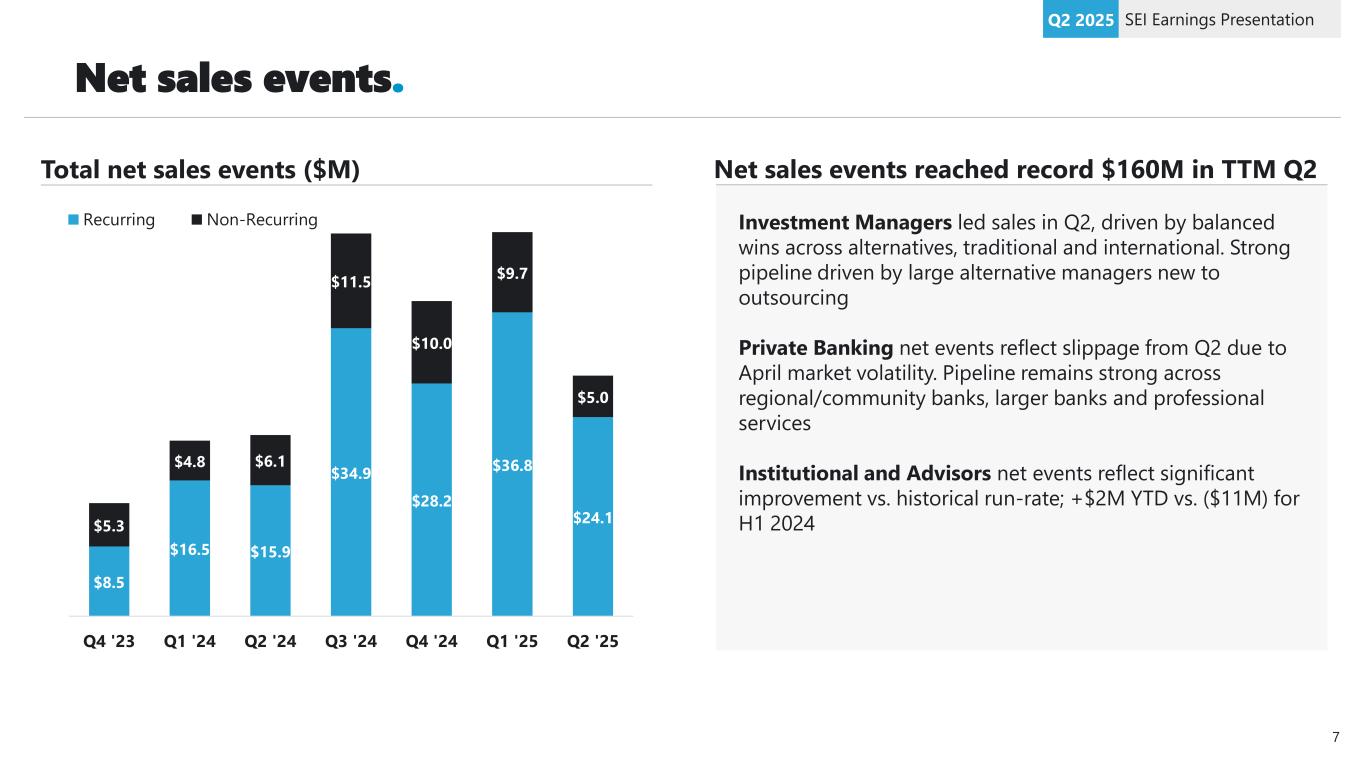
Net sales events. SEI Earnings PresentationQ2 2025 $8.5 $16.5 $15.9 $34.9 $28.2 $36.8 $24.1 $5.3 $4.8 $6.1 $11.5 $10.0 $9.7 $5.0 Q4 '23 Q1 '24 Q2 '24 Q3 '24 Q4 '24 Q1 '25 Q2 '25 Recurring Non-Recurring Total net sales events ($M) Investment Managers led sales in Q2, driven by balanced wins across alternatives, traditional and international. Strong pipeline driven by large alternative managers new to outsourcing Private Banking net events reflect slippage from Q2 due to April market volatility. Pipeline remains strong across regional/community banks, larger banks and professional services Institutional and Advisors net events reflect significant improvement vs. historical run-rate; +$2M YTD vs. ($11M) for H1 2024 Net sales events reached record $160M in TTM Q2 7
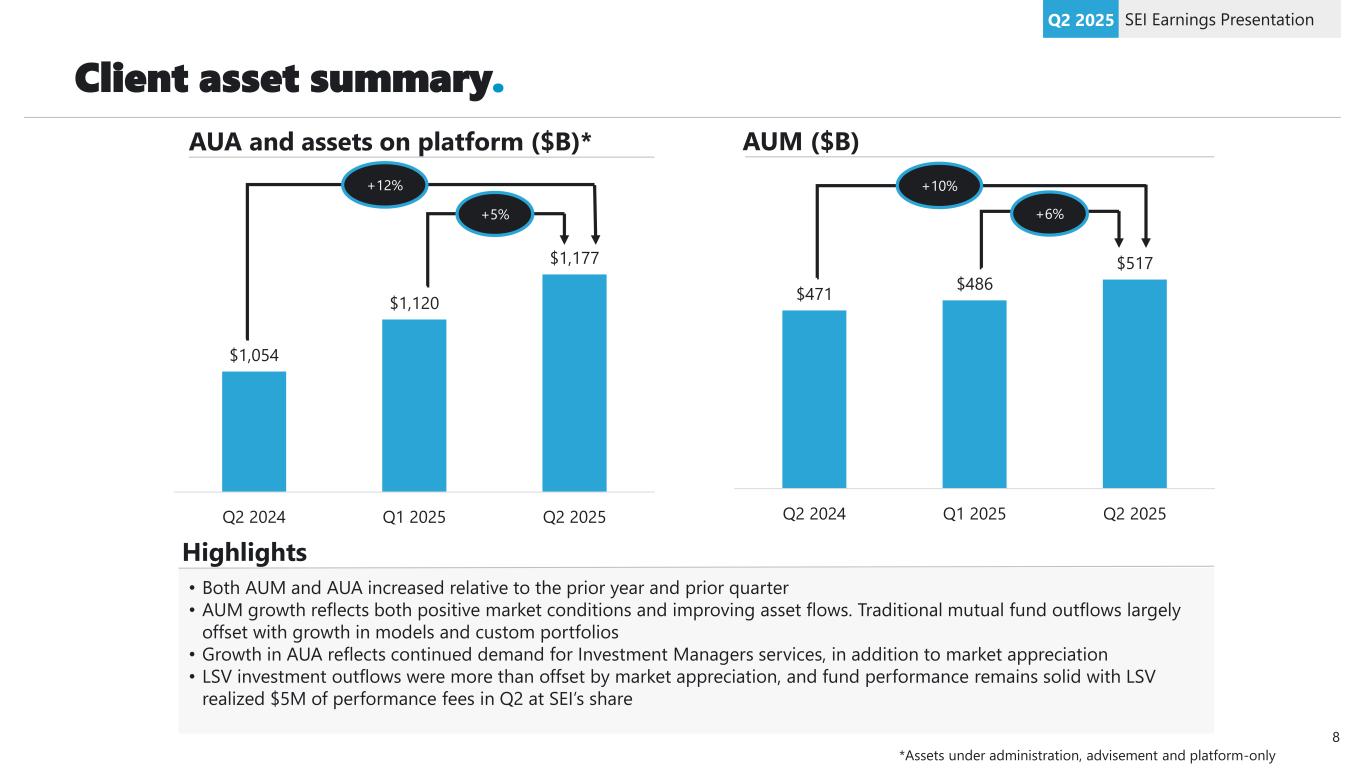
Client asset summary. SEI Earnings PresentationQ2 2025 AUA and assets on platform ($B)* AUM ($B) $1,054 $1,120 $1,177 Q2 2024 Q1 2025 Q2 2025 +12% +5% $471 $486 $517 Q2 2024 Q1 2025 Q2 2025 +10% +6% Highlights • Both AUM and AUA increased relative to the prior year and prior quarter • AUM growth reflects both positive market conditions and improving asset flows. Traditional mutual fund outflows largely offset with growth in models and custom portfolios • Growth in AUA reflects continued demand for Investment Managers services, in addition to market appreciation • LSV investment outflows were more than offset by market appreciation, and fund performance remains solid with LSV realized $5M of performance fees in Q2 at SEI’s share *Assets under administration, advisement and platform-only 8
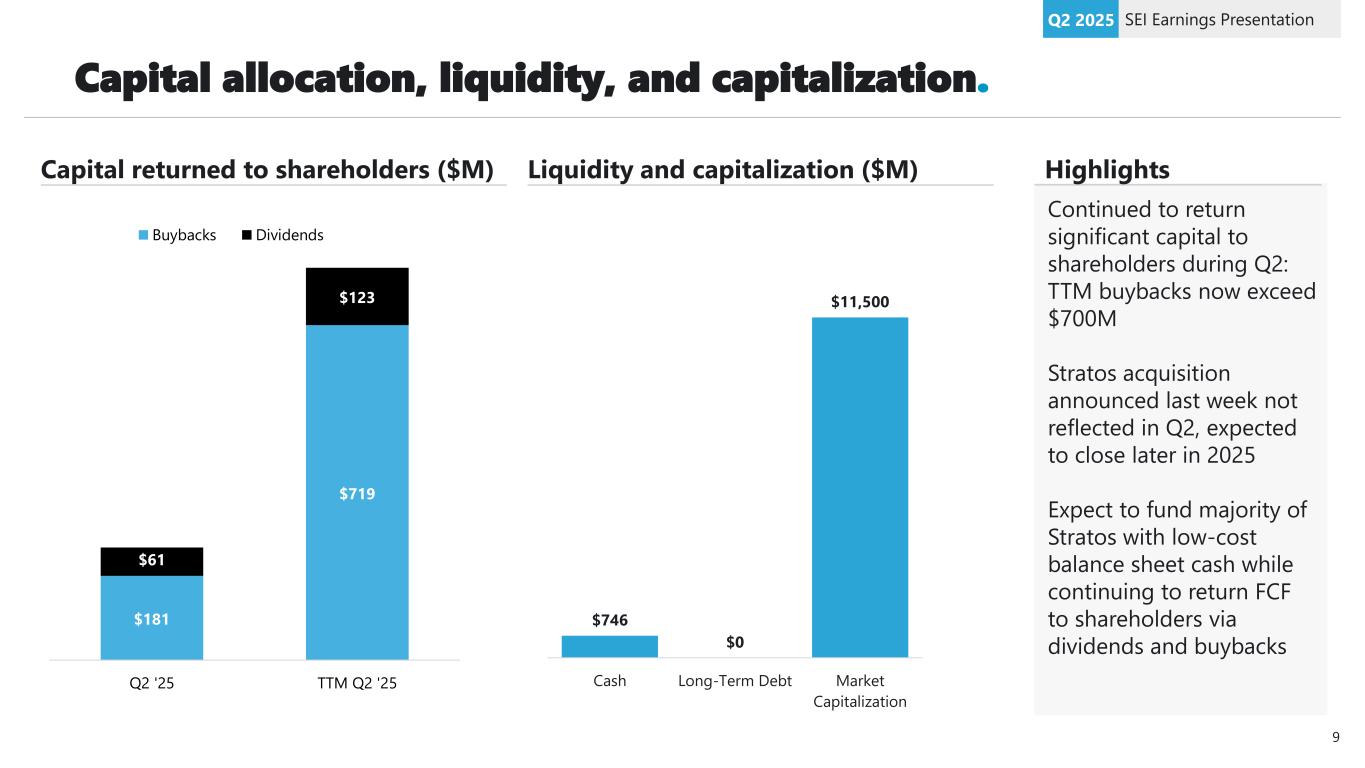
Capital allocation, liquidity, and capitalization. SEI Earnings PresentationQ2 2025 $181 $719 $61 $123 Q2 '25 TTM Q2 '25 Buybacks Dividends Capital returned to shareholders ($M) Liquidity and capitalization ($M) $746 $0 $11,500 Cash Long-Term Debt Market Capitalization Continued to return significant capital to shareholders during Q2: TTM buybacks now exceed $700M Stratos acquisition announced last week not reflected in Q2, expected to close later in 2025 Expect to fund majority of Stratos with low-cost balance sheet cash while continuing to return FCF to shareholders via dividends and buybacks Highlights 9

For institutional investor and financial advisor use only. Not for distribution to general public. Thank you. 10